

A New Era for the Catholic Church: White Smoke Signals the Election of a New Pope
Tháng 5 8, 2025
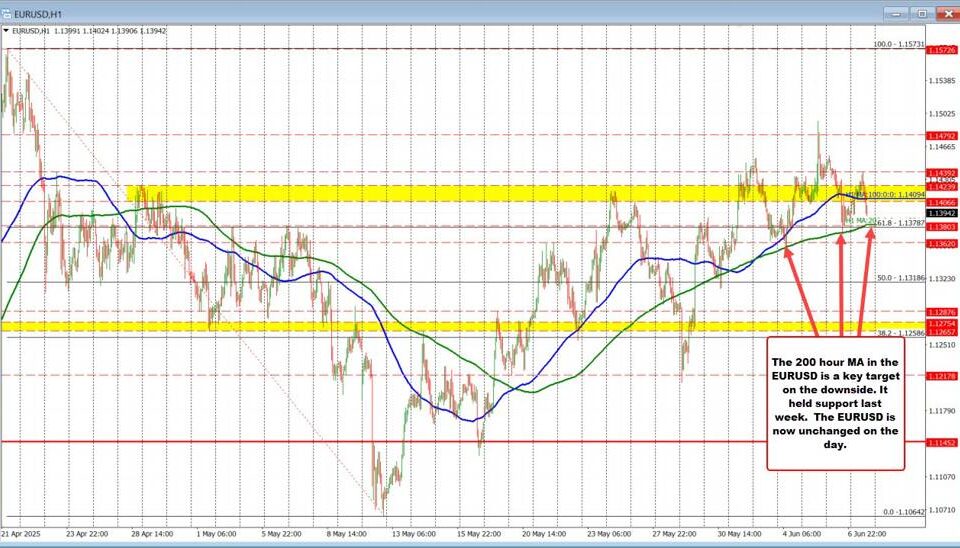
EUR/USD Currency Pair Plummets: Bearish Trend Intensifies after Support Break
Tháng 5 8, 2025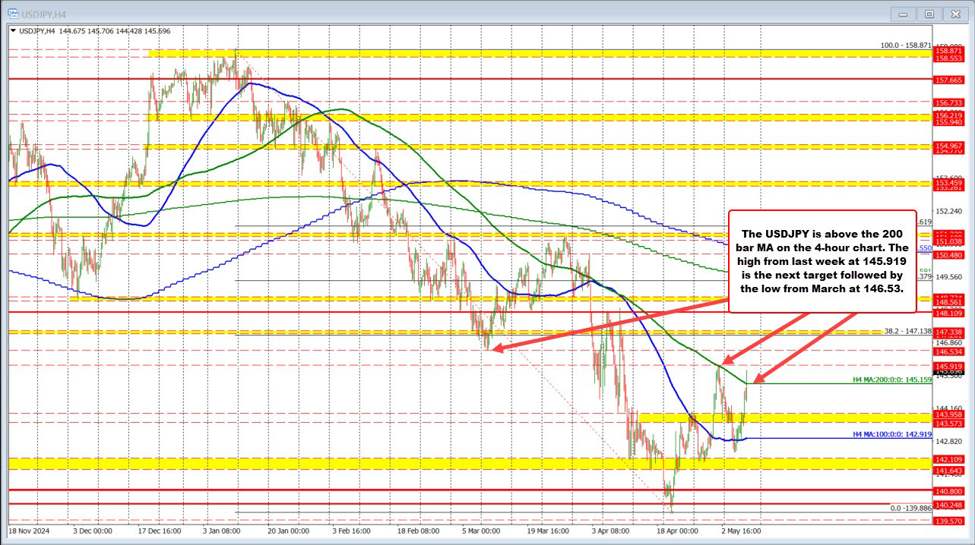
USDJPY Technical Outlook: Breaking Down Current Trends and Price Levels
Current Technical Picture
In the evolving landscape of forex trading, the USDJPY currency pair has recently emerged as a focal point of interest among traders and analysts alike. The latest technical analysis reveals that USDJPY has successfully breached the 200-bar moving average on the 4-hour chart. This pivotal development is often viewed as a bullish signal, indicating a potential shift away from the prior bearish corrections. Traders interpret this movement as an affirmation of short-term momentum, suggesting that the pair may be entering a strengthening phase after a period of consolidation.
As USDJPY approaches a critical resistance zone around the 144.00 level, traders are keenly watching for potential breakout scenarios. Successfully breaching this resistance could pave the way for further upward movement towards the next targets of 145.85 and even 148.50. It is essential to understand that while the short-term sentiment appears bullish, the daily chart’s Elliott Wave analysis conveys a bearish trend, adding a layer of complexity to market predictions. The short-term bullish correctional wave might indicate a potential re-test or breakout, but vigilance is required as market dynamics rapidly evolve.
Indicators and Momentum Signals
The Relative Strength Index (RSI) is providing key insights into current market conditions. After reaching overbought levels, the RSI is showing early signs of negative overlap. This behavior suggests that the current advance may experience a minor pullback, providing traders with an opportunity to address overbought conditions. Initially, these fluctuations could create a more favorable entry point for those looking to capitalize on the market’s next move.
Key levels in this analysis further underscore the importance of technical data in shaping trading strategies. The 142.00 level remains a vital support zone, serving as an intraday floor that traders are closely monitoring. If USDJPY were to breach this level, it would signal a potential return to a bearish trend, leading to further declines towards lower support zones. In contrast, maintaining momentum above the 144.00 resistance could catalyze a more robust bullish trend.
Catalysts and Market Dynamics
Market catalysts, including upcoming macroeconomic events such as the Federal Open Market Committee (FOMC) rate decision and U.S. Jobless Claims data, are anticipated to influence volatility and potentially alter the direction of short-term momentum. As traders await these updates, the interplay of macroeconomic factors with technical indicators will be instrumental in shaping future price movements.
Conclusion
To summarize, while the USDJPY is currently showcasing bullish characteristics on shorter timeframes with its movement above crucial moving averages and nearing resistance at 144.00, traders should remain cautious due to the present overbought conditions. A decisive move past 144.00 could spark a surge in bullish momentum, yet the bearish signals present on the daily chart remind investors to exercise prudence. Moreover, should the pair break below the significant 142.00 support level, it would undoubtedly shift the overall market outlook, prompting a reassessment of trading strategies.
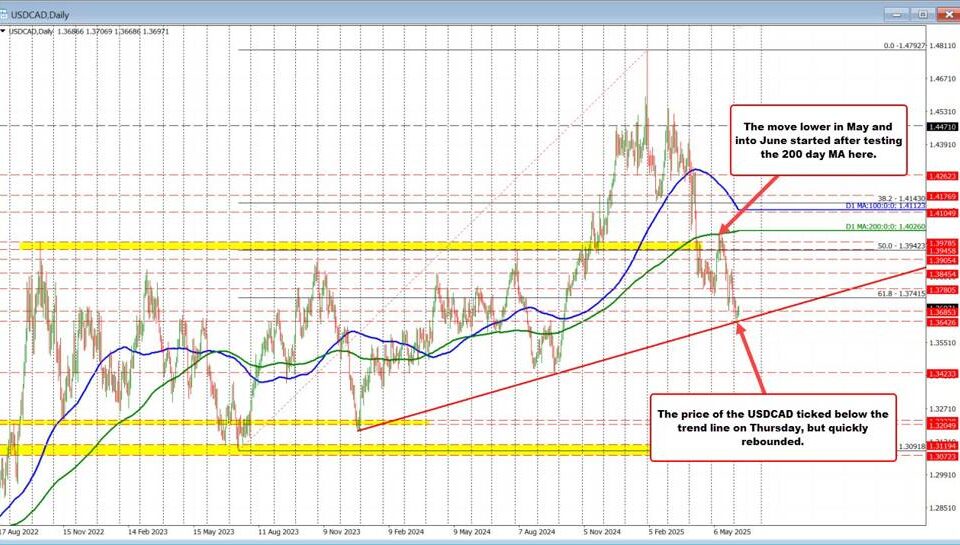
For those closely following other currency pairs, it may also be worthwhile to explore insights on the current market conditions for USD/CAD, reflecting a neutral trend in the forex market (details here). Similarly, the GBP/USD pair is also exhibiting limited volatility and may provide additional trading opportunities as the market awaits more definitive signals (check this analysis). Furthermore, insights on the EUR/USD would be helpful as it shows bullish momentum amid consolidation which could influence overall market sentiment (find more here).