
USDJPY Market Prediction: Sideways Trend Amid Greedy Sentiment
Tháng 5 16, 2025XAUUSD Market Prediction: Sideways Trend Analysis
Tháng 5 16, 2025USDCAD Sentiment Shift Analysis: Trader Position Changes
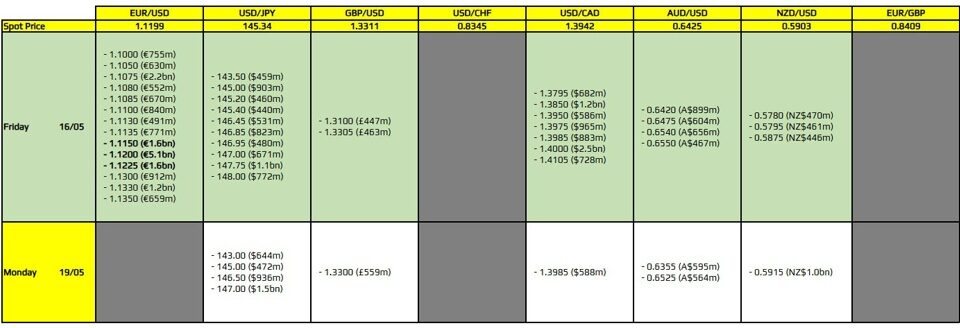
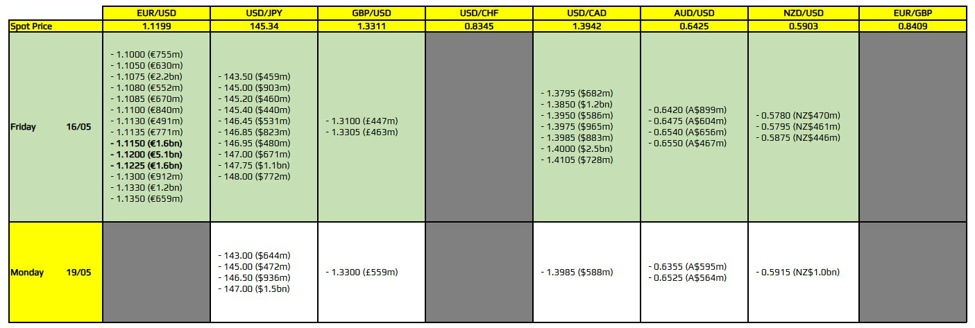
USDCAD Technical Data Point: Long at 41%, Short at 59%
In the current USDCAD market, the sentiment analysis reveals that trading positions are predominantly short. With 59% of traders holding short positions compared to 41% in long positions, there is an apparent bearish sentiment prevailing among market participants. This level of positioning indicates that a significant portion of the market is anticipating USDCAD to move lower, potentially due to various macroeconomic factors or market expectations not detailed in this data set. The higher short position can often signal trader fear regarding USDCAD’s further potential for upward movement, causing a potential sideways trend as market participants await clearer directional signals.
Correlation Between USDCAD Sentiment and Price Action
The correlation between trader sentiment and the resultant price action in USDCAD is a crucial aspect of market analysis. When the market adopts a majority short position, as seen with the current 59% short sentiment, there is often a cautious or fearful outlook regarding potential bullish breaks. This sentiment-driven market behavior can lead to sideways trading conditions, where the price oscillates within a range rather than making decisive moves in either direction. Such conditions reflect trader fears and indecision, further influencing the sideways movement of the currency pair. It reveals that despite a bearish consensus, a sustained downward movement might be hesitant or delayed as traders watch for more definitive economic indicators or market catalysts.
USDCAD Price Prediction Based on Sentiment Analysis
USDCAD Statistical Confidence Levels and Targets
The USDCAD currency pair has recently showcased a sideways trading behavior. This movement indicates investor hesitation, often linked with market fear. The USDCAD’s current sideways pattern suggests that traders are uncertain about the economic indicators from the United States and Canada, reflected in the fluctuating exchange rate. This reflects a cautious approach given the lack of clear economic growth signals or policy changes from either country’s central banks.
Technical indicators, often employed to gauge investor sentiment, reveal subdued volatility in the USDCAD market. Analysis of recent trends in the exchange rate might depict pivotal resistance and support levels where past price reactions have occurred. In a sideways market, these levels become crucial focal points for traders anticipating breakouts or contemplating reversions. However, an exact statistical confidence level and specific target numbers for these technical indicators have not been provided, highlighting a gap in data-driven decision-making in current market sentiment analysis.
Investors closely observing the USDCAD must manage their expectations with a mix of prudence and readiness to adapt strategies. The sentiment-driven sideways trading emphasizes the importance of remaining informed about macroeconomic announcements, which can disrupt the current pattern. As fear lingers and sentiment continues to shape the market, being vigilant about geopolitical developments and central bank communications is paramount for navigating this currency pair’s potential future movements.
USDCAD Trading Strategy Recommendations
Navigating the foreign exchange market requires keen insight into the dynamic nature of currency pairs. For the USDCAD pair, recent analysis indicates a sideways movement, reflecting a period of consolidation where prices are oscillating within a defined range. Such behavior is often interpreted as market fear, where traders exhibit caution amid uncertainty, avoiding major directional moves.
For traders looking to capitalize on the sideways nature of USDCAD, employing range-bound trading strategies could prove effective. This involves identifying key levels of support and resistance, allowing traders to buy near support and sell near resistance. Given the prevailing fear and hesitation in the market, leveraging indicators like the Relative Strength Index (RSI) and Moving Averages could assist in pinpointing optimal entry and exit points.
Moreover, in a sideways market, it’s crucial to implement tight risk management techniques. With USDCAD showing limited trends, the potential for false breakouts increases. As such, traders should set stop-loss orders judiciously to mitigate losses in case of sudden volatility.
By tailoring strategies to the current sideways conditions and the underlying fear that influences trading behavior, traders can enhance their chances of achieving favorable outcomes with the USDCAD pair.
