
USD/CHF Technical Analysis: Navigating Key Levels in Volatile Markets (May 2025)
Tháng 5 6, 2025Canada’s April PMI Signals Economic Contraction: What It Means for Businesses and Policy
Tháng 5 6, 2025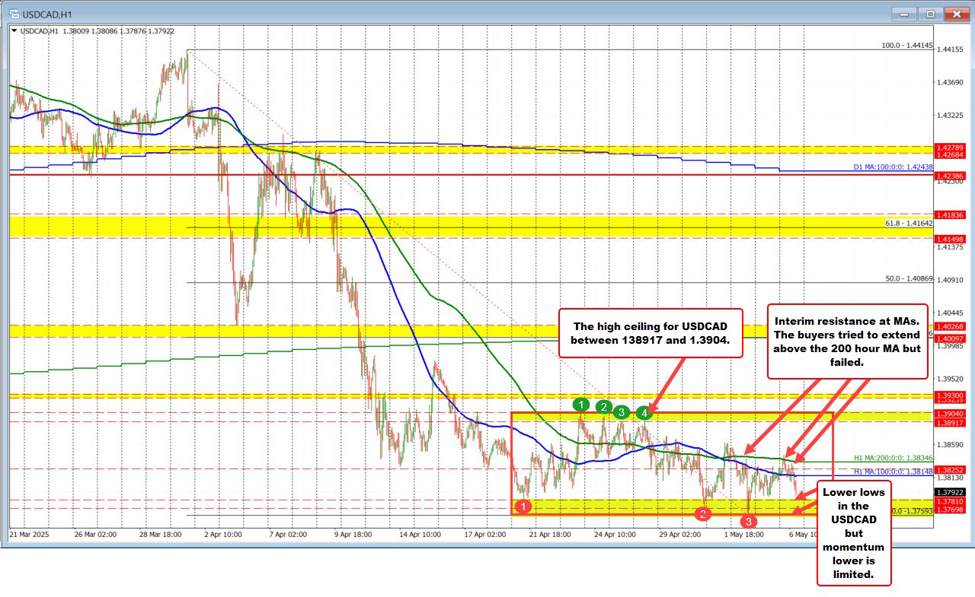
USDCAD Technical Analysis for May 6, 2025: Navigating Resistance and Support Dynamics
The USDCAD currency pair is currently demonstrating a complex pattern that traders must navigate carefully. As of May 6, 2025, the price action shows a downward trajectory; however, momentum appears to be waning. The pair is encountering considerable resistance at the 1.38148 level, which aligns with the 100-hour moving average, and at 1.38346, corresponding with the 200-hour moving average. These technical indicators are pivotal in setting the stage for potential price movements in the near term.
Key Resistance Levels
A critical resistance zone looms at 1.3892, which traders should watch closely. If bullish momentum strengthens, this level could act as a significant barrier, challenging the upward movement of USDCAD. A breakthrough above this resistance might open the doors for a bullish trend, yet the current signals suggest that the pair is more likely to remain constrained within its existing boundaries.
Intraday Support Analysis
On the contrary, a robust level of support has been established around 1.3780, which has held firm in recent trading sessions. This stability is further reinforced by RSI-positive signals, providing a glimmer of hope for traders who are looking for upward retests. The Relative Strength Index indicates that the pair might be gaining momentum, but caution is warranted as mixed signals continue to emerge from broader trends.
The Bearish Channel Observation
Further complicating the outlook is the presence of a minor bearish channel visible on the short-term charts. The EMA50 has also positioned itself as a formidable resistance barrier at current levels, stymying any short-term bullish prospects. This indicates that while there may be pockets of support, the overarching trend may still be bearish unless substantial buying pressure emerges.
Broader Market Context
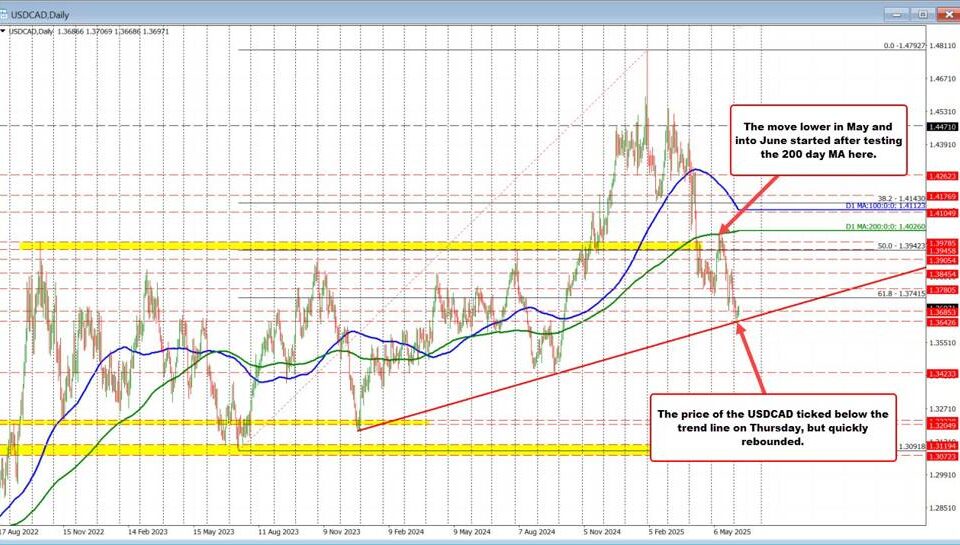
Referring back to earlier analysis from May 5, the expectation for a bearish continuation toward 1.3685 could come into play should the 1.3745 support level break. The proximity of this potential breakdown emphasizes the necessity for traders to remain vigilant on these key levels. Recent market dynamics present a dichotomy: resilience around 1.3780 stands at odds with broader channels suggesting downward pressure. For further insight on the current neutral trend between USD and CAD, you can check Neutral Undertones: Shaping the Short Term Market Outlook for USD/CAD.
Conclusion: Monitoring Key Levels
In conclusion, traders should remain attentive to the 1.3745–1.3780 support and the moving average resistance zones as they seek directional cues in the USDCAD pair. The interplay between outlined support and resistance levels suggests a period of caution and assessment ahead. As the market rhythm evolves, staying abreast of these technical indicators will be crucial for making informed trading decisions. The balance between resilience and bearish tendencies continues to keep the USDCAD within a watchful trading environment, making it imperative to analyze each development closely.