

Hollywood Tariffs: Navigating the Controversy and Its Impact on Film Production
Tháng 5 13, 2025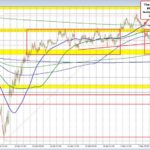
AUDUSD Analysis: Key Resistance at the 200-Day Moving Average
Tháng 5 13, 2025
USDCAD Technical Analysis: Navigating the 200-Day Moving Average Resistance
Recent market dynamics involving the USDCAD currency pair have brought it to a critical juncture, where it has encountered significant resistance at the 200-day moving average (MA) and a crucial swing area. This technical milestone suggests that market participants are leaning towards selling at these levels, raising red flags for potential buyers and indicating a possible continuation of the ongoing downtrend or corrective phase.
Recent Price Action and Key Technical Indicators
In the latest price movements, USDCAD managed to break above the 1.3900 mark during both the Asian and early European trading sessions. This surge was characterized by a consolidation of gains, marking a significant shift for the pair. The entry into the 1.3900 range coincides with several critical factors, including the presence of the 200-day MA and historical swing highs, where sellers have exhibited a strong inclination to act.
Short-term technical indicators such as the Alligator and Bollinger Bands suggest the possibility of an upward correction or a reversal from the established support levels. However, the overarching trend appears to remain bearish, particularly with previous support levels—specifically in the 1.3800 to 1.3840 range—now holding pivotal significance. A downward breach of these levels could pave the way toward achieving lower targets around 1.3750. Conversely, if the pair manages to maintain its position above these support levels, it could target higher resistance in the vicinity of 1.3980 to 1.4000.
Fundamental Influences on Market Sentiment
The Canadian dollar has been adversely affected by recent economic data, notably the rising unemployment rate of 6.9%, along with ongoing tensions in US-Canada trade relations. This economic backdrop has weighed heavily on the Canadian dollar (CAD), while consistent interest rates set by the Federal Reserve have bolstered demand for the US dollar (USD). These factors contribute to the neutral trend observed in the forex market, as discussed in detail in this blog.
Currently, market sentiment reflects a mixed but cautiously optimistic perspective. Although intraday momentum is positive—supported by bullish patterns like the Engulfing candle formation evident on weekly charts—the sustained selling pressure at the 200-day MA/swing area indicates that the potential for upward movement may be limited in the short term.
Conclusion: A Critical Eye on Resistance Levels
The recent interaction of USDCAD with the 200-day MA and nearby swing area has underscored a clear resistance zone, leading to active selling. Even though short-term indicators hint at potential upward movement, the resistance line at 1.3900 and beyond remains tough to breach, emphasizing the need for caution among traders.
As USDCAD navigates this technical landscape, all eyes will be on the upcoming price action to see whether it can hold above the critical support levels or if it will ultimately succumb to the resistance posed by this pivotal moving average and swing area. The coming days will be crucial in determining whether market participants will witness a bullish resurgence or a reinforcement of the prevailing bearish trend.