Bullish Prospects for US Dollar vs Canadian Dollar Pair Amid Overbought Concerns – 01/04/2025
Tháng 3 31, 2025
A Comprehensive Analysis of the GBP/USD Currency Pair: Understanding the Inevitable Sideways Market Movement – 01/04/2025
Tháng 3 31, 2025Market Overview
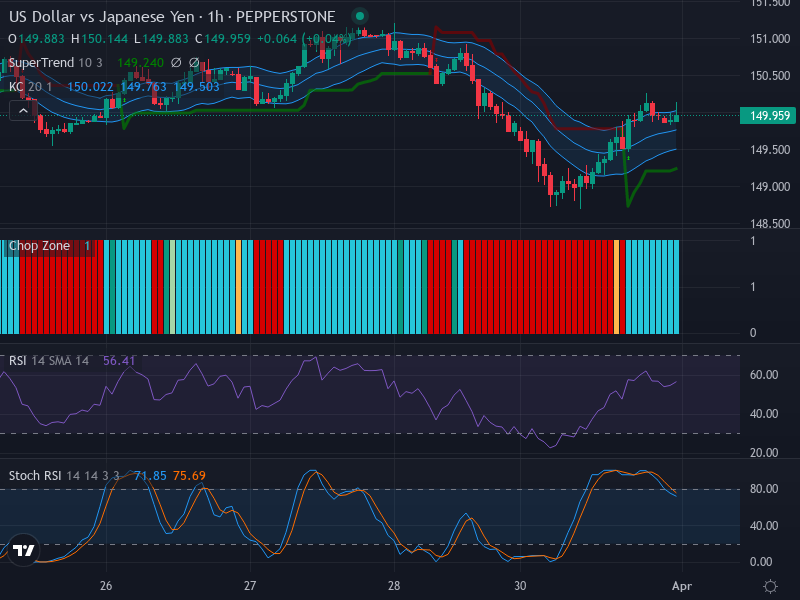
The USD/JPY currency pair seems to be gearing up for a possible rally in the Forex market as recent candles show a potential bullish reversal. Despite lacking a decisive bullish engulfing pattern, the pair has been trading within a lateral to slightly upward market direction, signaling a potential accumulation phase before the next bullish wave. However, the resistance zone near 150.500 and support around 149.000 should offer crucial reference points for traders.
Technical Analysis
Delving into the technical analysis, the present candlestick pattern isn’t denoting a confirmed bullish reversal yet, albeit the sideways to marginally upward market direction is an important prelude to a likely bullish shift. The price is courtesy of a possible tug of war between the bulls and bears, with both factions vying for control.
The Relative Strength Index (RSI), registering a value of 56.4, placidly sits in the neutral territory. The slightly upward sloping RSI might hint at bullish dominance in the near term; however, it’s too feeble to conclusively substantiate a strong bullish trend at present.
Evaluating the Keltner Channels, the price is inching close to the middle band, hinting at a likely range-bound market situation unless broken out. The accompanying Chop Zone bars, too, suggest that the market has been primarily moving sideways, albeit showing signs of reduced volatility. A potential breakout looms if the price closes above 150.500 and the Chop Zone flips to neutral.
Moreover, the Stochastic RSI makes for interesting scrutiny. With both the K (71.85) and D (75.69) lines oscillating high, it indicates potential overbought conditions. The recent bearish crossover casts a shadow of likely downward price correction in the short-term view—a slight deviation from the current upward market momentum.
Conclusion and Trading Recommendations
While the technical analysis indicates a possible bullish reversal for the USD/JPY pair, contrasting signals from the Stochastic RSI suggest overbought conditions and a potential bearish correction, rendering the trading landscape a bit intricate. Therefore, traders are recommended to await a more explicit signal—preferably a breakout above the resistance level of 150.500 for a long position, or a breach of the support at 149.000 for a potential short position—before committing to their trades.
Potential Entry Points:
- Buy Entry Point: 150.600 | Take Profit Point: 151.200 | Stop Loss Point: 150.200
- Sell Entry Point: 148.800 | Take Profit Point: 148.000 | Stop Loss Point: 149.400
Overall Market Trend Analysis:
Analyzing various time frames leads us to the following insights:
- 1-Week Trend: The trend appears to be slightly bullish; however, consolidation may be underway, indicating caution.
- 1-Day Trend: The daily analysis shows some upward momentum, although the overbought conditions suggest a potential pullback could occur.
- 4-Hour Trend: The 4-hour chart presents mixed signals with volatility reducing; a decisive break above or below key levels is needed to confirm the direction.
Given the current analysis and the nuances evident in the charts, the likelihood of a Buy scenario seems more probable, particularly if the resistance level is convincingly breached.