
US Dollar vs Canadian Dollar: Bullish Resurgence Amid Neutral Market Positioning – 07/04/2025
Tháng 4 6, 2025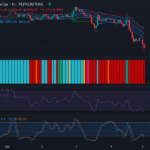
Gold vs US Dollar – An Unwinding Bearish Trend: Temporary Relief or Continued Descent? – 07/04/2025
Tháng 4 6, 2025Market Overview
Over recent trading sessions, the US Dollar versus the Japanese Yen (USD/JPY) continues its journey down the path of depreciation. The bearish candlesticks, representative of the bearish sentiment, dominate the 1-hour chart. However, the currency pair hovers just above the oversold territory, potentially indicating an upcoming stabilization or even a minor correction to the downward trend.
Technical Analysis
In a detailed examination of the recent trading activity, the pair has lacked any significant bullish reversal patterns. This includes patterns like bullish engulfing or hammer, emphasizing the unbroken bearish run.
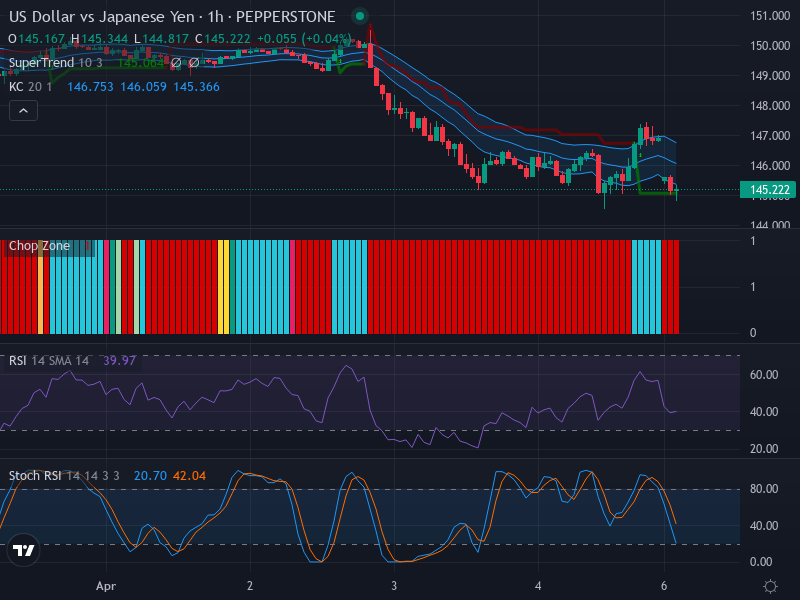
The technical marker, Relative Strength Index (RSI), currently registers a value of 39.97. This lands the asset in a territory that is leaning more towards oversold than overbought. Although the RSI shows the potential for stabilization or a slight upward bounce, it does not disqualify the ongoing downward trend.
Meanwhile, the Stochastic RSI (Stoch RSI) presents intriguing data. The K line (20.70) is observed to have dipped below the D line (42.04), a move typically associated with an incoming bearish run. Interestingly, both lines are hovering close to the oversold region, which hints towards a possible consolidation or bullish price reversal soon.
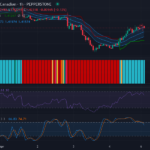
The Keltner Channels and Chop Zone indicators further solidify the current bearish condition. The USD/JPY pair continues to trade below both the EMA 20 and the Keltner Channel, reconfirming the long-term downward trend. The channel’s width remains stable, advocating for no significant changes in volatility.
Lastly, the Chop Zone indicator, represented by consistent red bars, signals the absence of a clear trend direction. This could potentially hint at market indecision and a forthcoming pivotal moment for the currency pair.
Conclusion and Trading Recommendations
Bearing in mind the analysis, it’s evident that the USD/JPY currency pair is in the middle of a downward trend. However, certain indicators like the RSI and Stoch RSI might suggest an upcoming reversal or at least a consolidation in the short-term. Thus, traders should closely monitor the level of 146.000 as a possible retracement level, which also coincides with the upper Keltner Channel.
Given the potential market developments, traders might consider a wait-and-see approach for clear indicators of either a continued downward trend or a reversal before executing any trades.
Trading Trend Analysis:
- 1-Week Time Frame: The overall trend remains considerably bearish with no signs of reversing.
- 1-Day Time Frame: A temporary consolidation phase might be ongoing but still reflects a bearish sentiment.
- 4-Hour Time Frame: The indicators also suggest a potential exhaustion of the downtrend, paving the way for a possible short-term reversal.
While analyzing the indicators, potential entry points at the 1-hour time frame present a clearer picture. For a Buy scenario, traders may consider an entry at 146.000, with a Take Profit at 147.000 and a Stop Loss at 145.500. Conversely, in a Sell scenario, the entry may be positioned at 145.800, targeting a Take Profit at 144.800, with a Stop Loss at 146.200. At this moment, the likelihood leans towards a Buy scenario, given the slight indicators of potential reversal.


