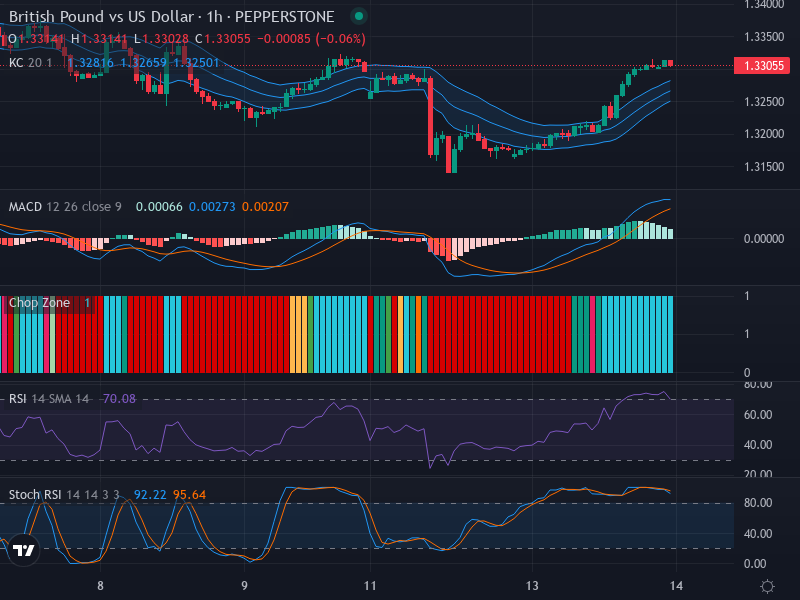
Optimistic Bullish Revival: A Comprehensive Analysis on GBP/USD Forex Pair – 12/05/2025
Tháng 5 11, 2025
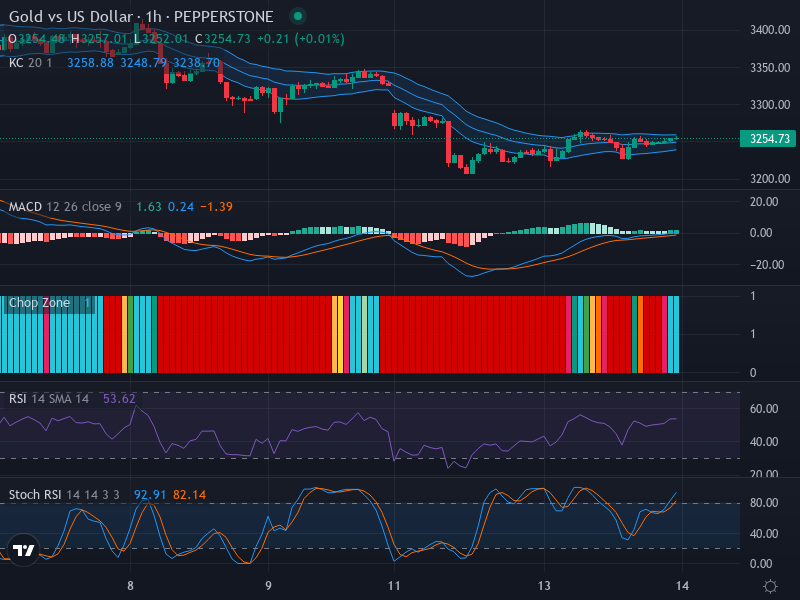
Gold vs US Dollar: A Downward Dance Persists, With a Watchful Eye on Potential Short-Term Reversal – 12/05/2025
Tháng 5 11, 2025Market Overview
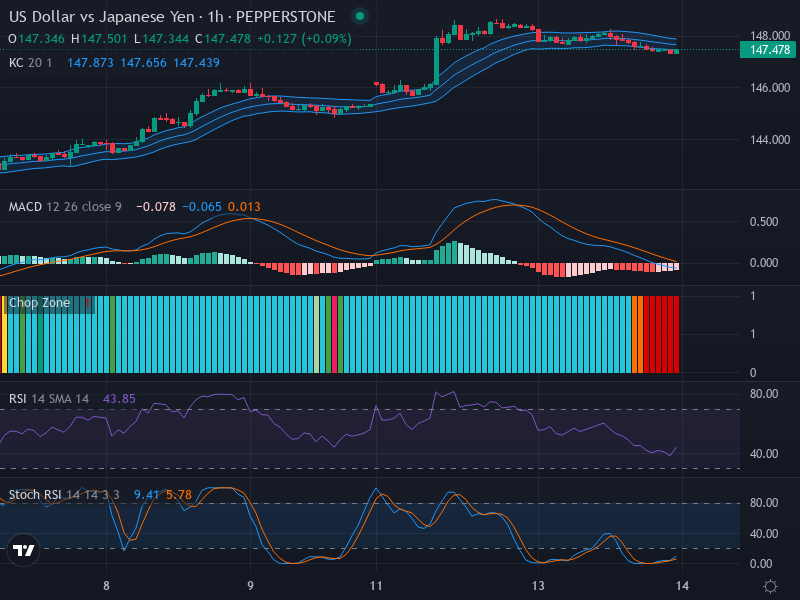
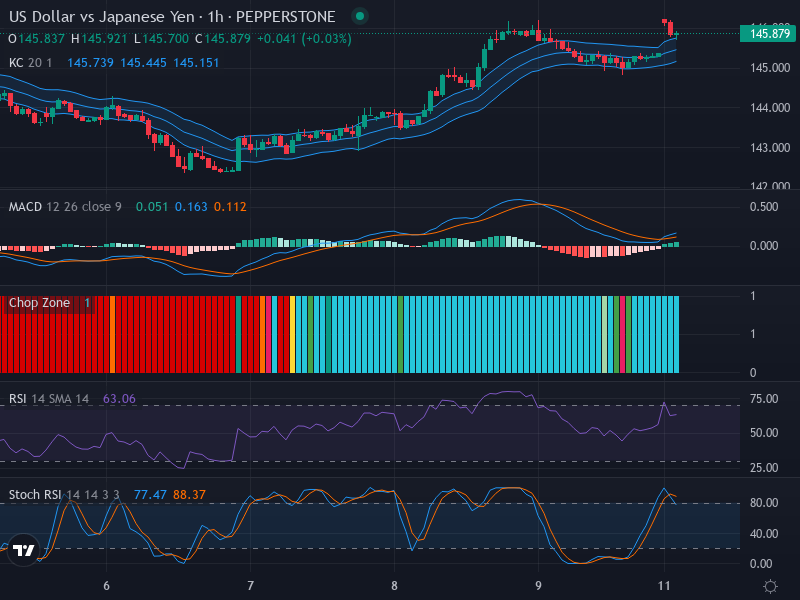
The USD/JPY currency pair is currently trading at 145.879, demonstrating a notably strong upward tilting trend. This trend has been established based on the analysis of recent candlestick formations. Although minor fluctuations have been observed, these have not translated into significant reversal patterns, suggesting that the pair could potentially continue moving upwards.
Technical Analysis
Upon closer examination of the chart, a key resistance point emerges around the 146.500 mark. It forms a pivot point that traders should watch out for, as a breach of this level might confirm the sustainability of the ongoing uptrend, while a rejection could imply a potential reversal.
As per the technical indicators, the Relative Strength Index (RSI) value stands at 63.06, which is relatively high and could indicate overbought conditions if continued. However, the absence of clear divergence further supports the prospect of continuous upward price movement.
The Stochastic RSI echoes this interpretation. With the ‘K’ value at 77.47 and ‘D’ value at 88.37, the lines currently reside in the overbought zone. This, in turn, could signal a price correction or consolidation in the advent of decreasing upward pressure. A recent crossover event in the Stochastic RSI further implies sustained bullish momentum.
Regarding the Moving Average Convergence Divergence (MACD), bearish signals seem to be in play, with the MACD line standing below the signal line at present. However, a bearish crossover is contrasted by a visible increase in the histogram bars, pointing towards a potential resurgence of bullish momentum in alignment with the currency pair’s pestilent upward trajectory.
Moreover, a glance at the Keltner Channels reveals how the price is trading near the upper band, traditionally associated with overvalued market conditions.
Conclusion and Trading Recommendations
Drawing from the preceding analysis, the USD/JPY pair confirms an upward trend, albeit encountering notable resistance at the 146.500 mark. Several indicators suggest overbought conditions; however, absent divergences and a recent bullish crossover in the Stochastic RSI testify to sustained buying pressure.
Time Frame Analysis
In the 1-week time frame, the trend appears to be strongly bullish, with indicators supporting an ongoing upward movement. The 1-day analysis reflects a continued uptrend, although some indicators suggest potential overbought conditions. On the 4-hour time frame, the price still shows resilience, holding above key moving averages that highlight the bullish trend despite some minor pullbacks.
Potential Entry Points:
- Buy Entry Point: 145.900, Take Profit Point: 146.500, Stop Loss Point: 145.600
- Sell Entry Point: 146.500, Take Profit Point: 145.400, Stop Loss Point: 146.700
Overall, the Buy scenario appears more likely to occur, given the current bullish momentum and patterns observed in the analysis. However, traders should remain cautious and apply risk management strategies, particularly as the markets approach the key resistance level.