
Bearish Momentum Dominates: An In-depth Overview of Trend Reversal Possibility – 01/05/2025
Tháng 4 30, 2025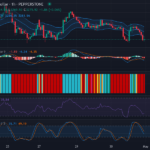
The Bearish Grip Tightens on Gold vs US Dollar: A Technical Analysis Perspective – 01/05/2025
Tháng 4 30, 2025Market Overview
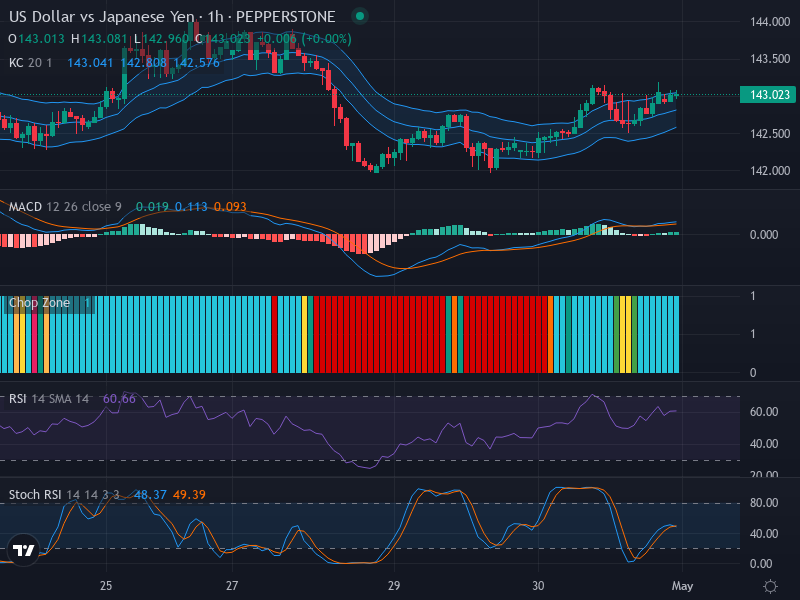
The USD/JPY currency pair is currently stationed at 143.023 and appears to be moving laterally. Recent candlestick formations illustrate a trend characterized by modest body sizes, thus indicating a prevailing market indecision. As both currencies struggle for dominance, the Forex market is trapped in a present standoff between USD bullishness and the counteracting force of the JPY.
Technical Analysis
The primary instrument for understanding this recent state of indecisiveness has been the Keltner Channel. Recent touches on the upper Keltner Channel insinuate potential resistance overhead, likely near the 143.500 mark. Conversely, if market sentiment shifts in favor of the JPY, the lower Keltner Channel would cap any decline around the 142.500 support level.
The RSI, currently around 60.66, insinuates a neutral stance, albeit with a tinge of bullish sentiment. This points towards a modest upward momentum, even though it does not denote an overbought market. The fact that the RSI has no substantial divergence from the price trajectory further bolsters this interpretation.
In alignment with the RSI, the Stochastic RSI largely buttresses the possibility of an upward nudge to the price level. The examination indicates that the K and D lines (at 48.37 and 49.39 respectively) seem close to converging, further reinforcing the prospects of an emerging bullish trend.
The potential uptrend is also reflected in the MACD analysis. Currently, the MACD is barely exceeding the signal line, signifying a marginally bullish crossover. While not concrete enough to justify intense optimism, this crossover trend lends additional credence to the possibility of intermittent bullish movements.
Conclusion and Trading Recommendations
In conclusion, the dominant sideways movement of the USD/JPY, compounded by an accompanying state of market indecisiveness, has created an investment space warranting meticulous scrutiny. While there are signals hinting at short-term bullish sentiment, investors should still exercise caution.
Given the technical indicators and context, traders might consider adopting a wait-and-see strategy for clearer patterns to emerge, unless they are comfortable with short-term positions leveraging the slight bullish undertones. A strategically calculated entry around lower channel (∼142.500) and exit slightly below the upper channel (∼143.450) could yield reasonable returns commensurate with analysis findings.
Trading Analysis
In evaluating the 1-week, 1-day, and 4-hour time frames, a few key points arise:
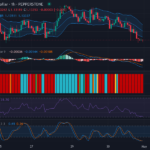
- 1-Week Time Frame: The market exhibits a sideways trend, with no clear direction. Price oscillation suggests a need for patience before committing to substantial positions.
- 1-Day Time Frame: A slight bullish momentum is being observed, but uncertainty prevails. The market could break either way depending on economic news and sentiment.
- 4-Hour Time Frame: Short-term buying opportunities may arise, confirmed by recent bullish signals in indicators, although volatility remains a concern.
Potential entry points can be identified using the 1-hour time frame:
- Buy Entry Point: 142.600, Take Profit Point: 143.450, Stop Loss Point: 142.300
- Sell Entry Point: 143.500, Take Profit Point: 142.800, Stop Loss Point: 143.700
Considering the mix of bullish signals alongside a broader market indecision, a Buy scenario appears slightly more favorable in the short term, especially if prices hold above the 142.500 support level.


