
Navigating Stock Market Turbulence: Decline or Opportunity?
Tháng 5 21, 2025
NIH Director Jay Bhattacharya Raises Eyebrows: The Controversial Debate on COVID-19 Origins
Tháng 5 21, 2025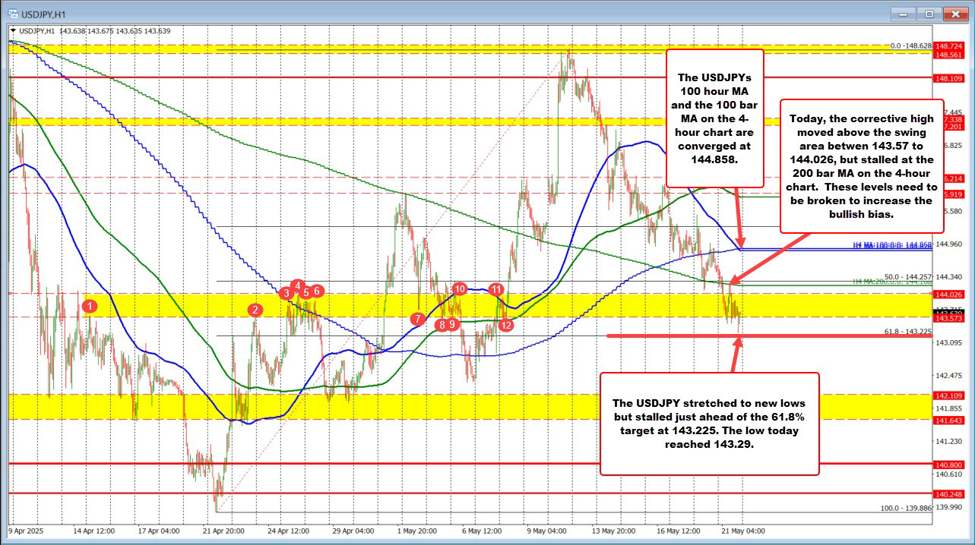
USD/JPY Technical Analysis: Navigating Crucial Fibonacci Levels for Future Movements
The USD/JPY currency pair has recently surged into the spotlight as its price movements continue to exhibit significant volatility. A recent analysis has revealed that the pair has dropped below a critical support zone, engaging closely with noteworthy Fibonacci retracement levels. This scenario is essential for traders and analysts, as understanding these price movements may unveil future trends in this pivotal currency pair.
Current Technical Situation of USD/JPY
The USD/JPY made headlines after breaching the 144.30-144.20 area, which represents a confluence of the 50% Fibonacci retracement level from the rally observed in April-May and the critical 200-period Simple Moving Average (SMA) on the 4-hour chart. This decisive breakdown not only acted as a bearish trigger but also amplified selling pressure, creating a more ominous outlook for the pair.
In the subsequent trading sessions, USD/JPY’s decline seemed to have paused just above the 61.8% Fibonacci retracement level, located around 143.24. This area is now being observed closely by traders as it may represent a re-entry point for buyers or a potential point for price consolidation. Technical indicators have begun signaling negative momentum on the daily chart—further solidifying a bearish sentiment in the near-term forecasts. Nevertheless, traders are advised to monitor for a sustained drop below the 143.45 level before anticipating more expansive declines.
If bearish pressure continues, USD/JPY might set its sights on lower support areas near 143.00 and subsequently toward the 142.40-142.35 range. With the psychological level of 142.00 looming, this scenario could present deeper support if the current downtrend persists.
Evaluating Bounce Potential and Alternative Price Action
Interestingly, on the 4-hour time frame, USD/JPY appears to be nearing the 78.6% Fibonacci retracement level, which ranges from approximately 141.76 to 143.80. Should the price maintain its position above this vital pivot area, it may produce a bounce that sparks a rally towards the first resistance point near 145.86. A sustained reversal would indicate a potential bullish recovery, while a decisive break below this pivot would confirm further downside and might send the pair toward the support at 142.39.
Analysts underscore the significance of the Fibonacci zone between the 76% and 90% retracement levels on the daily chart. If this trading range is supported by key demand zones and trendline dynamics, it could foster a bullish continuation, potentially pushing USD/JPY towards target levels around 148.68, assuming invalidation does not occur below 141.80. For broader insights into avoiding trading pitfalls during such volatile periods, you can check out guidance on common investment mistakes in the blog Top investment mistakes to avoid for 2023.
Resistance Levels and Recovery Prospects
On the upside, the pair is looking at resistance forming around the 144.55 to 145.00 area, with the psychological barrier around 145 often proving significant. Additionally, the 38.2% Fibonacci retracement level near the 145.35-145.40 range might act as a formidable cap for the pair’s upward momentum. A notable breach above this critical level could pivot the short-term bias back towards a bullish trajectory.
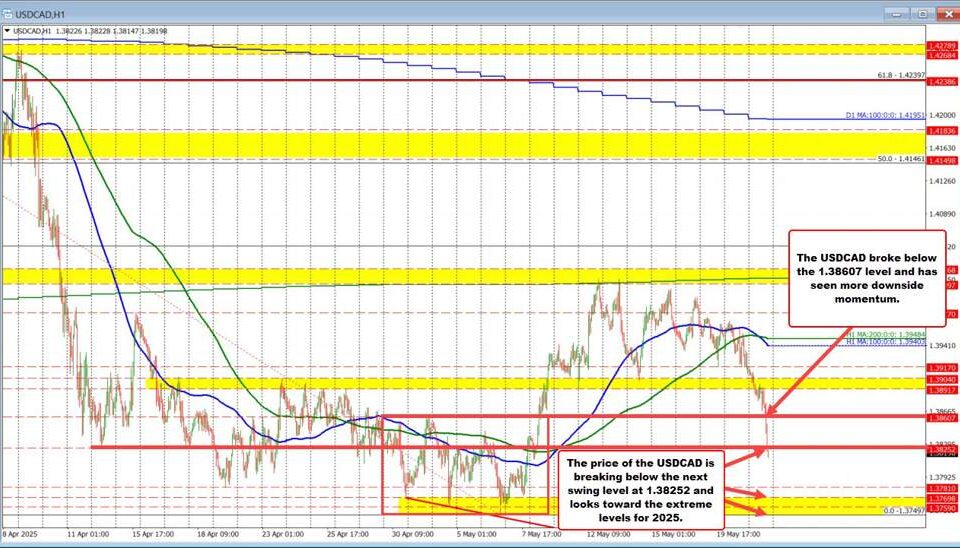
In conclusion, both technical indicators and Fibonacci retracement levels signify that the USD/JPY is currently perched at a vital juncture. The pair faces the possibility of either further bearish continuation below key support zones or a bounce that could reignite bullish trends. Major Fibonacci retracement levels appear to serve as crucial indicators for traders as they navigate their strategies in this increasingly dynamic currency market. As this analysis unfolds, prudent trading will require attentive monitoring of these pivotal levels to ascertain the future direction of the USD/JPY currency pair. For those interested in further forex analysis, consider the blog that discusses current market outlooks Neutral undertones shaping the short-term market outlook for USD/CAD.
