3 Reasons Joel Greenblatt Says Value Investing Beats the Market
Tháng 3 28, 2025
Australian Dollar vs US Dollar: A Detailed Technical Analysis and Potential Trade Opportunities – 29/03/2025
Tháng 3 28, 2025Market Overview:
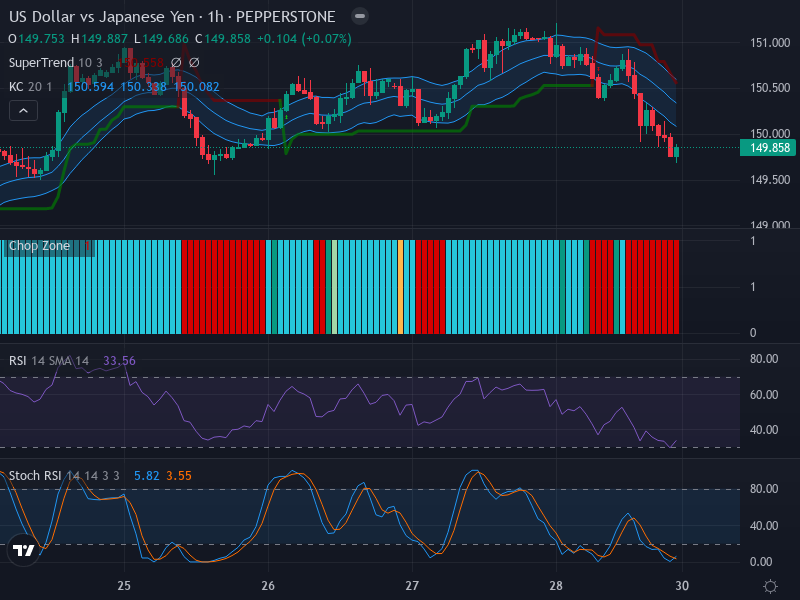
The USD/JPY has shown bearish activity, with a clear downtrend exhibited on the 1-hour chart. Numerous consecutive bearish candles have recently been observed, reporting a downward direction in this currency pair. The price recently closed below the middle line of the Keltner Channel, further indicating potential future downside movements. Traders should anticipate a probable support level around 149.500, likely to present an opportunity for a retracement before the asset resumes its downturn.
Technical Analysis:
Our analysis involves a comprehensive examination of diverse technical indicators. The Relative Strength Index (RSI) reports a value of 33.56, approaching oversold levels. This finding reinforces the existing bearish sentiment in the market—only solidifying the downward trajectory forecast. It’s noteworthy that there seems to be no divergence between the RSI and the price, highlighting a uniform market sentiment. If the current trend persists and the RSI dips further below 30, it could indicate an oversold condition—potentially signaling a short-term market bounce.
The Stochastic RSI (Stoch RSI) review adds an interesting layer to our analysis. The reported K and D values stand at 5.82 and 3.55 respectively, indicating an oversold market condition. An exciting prospect emerges with an oversold crossover in the Stoch RSI, which could presage a minor bullish correction in an extended oversold scenario.
Delving into the Keltner Channels and Chop Zone analysis, the market appears decidedly bearish. This is inferred from the price trending below the Keltner Channel’s middle line. The contracting Keltner channel implies abating volatility while securing the bearish momentum. Lastly, findings from the Chop Zone, characterized by predominantly red bars, ratify the prevailing downward trend tainted with minor sideways motions.
Conclusion and Trading Recommendations:
In summary, the USD/JPY pair offers a likely possibility of a sustained downward trend. Market indicators, including RSI and Stoch RSI, all support this bearish outlook. While an interim uptick might occur in response to oversold conditions, the overarching trend strongly indicates a bearish orientation.
In conclusion, based on the analysis of the 1-week, 1-day, and 4-hour time frames, traders may consider the following:
- 1-week timeframe: The overall trend remains bearish with increasing selling pressure.
- 1-day timeframe: A consolidation phase observed, but bearish indicators dominate.
- 4-hour timeframe: Active selling, with no significant reversal signs.
Given this analysis, traders may explore the following potential entry points:
- Buy scenario: Entry point at 150.000, take profit at 150.500, and stop loss at 149.800 to manage risk in case of further downturns.
- Sell scenario: Entry point at 149.400, take profit at 148.800, and stop loss at 149.600 to limit exposure in case of unexpected price actions.
Ultimately, the analysis strongly supports a Sell scenario for the USD/JPY. Traders should watch for retractments to optimal entry points while maintaining disciplined risk management strategies.