
British Pound vs US Dollar: A Comprehensive Technical Analysis Amidst A Dominant Downward Trend – 24/04/2025
Tháng 4 23, 2025
A Detailed Overview of Gold vs US Dollar: Potentially Stabilizing After a Period of Downward Trend – 24/04/2025
Tháng 4 23, 2025Market Overview
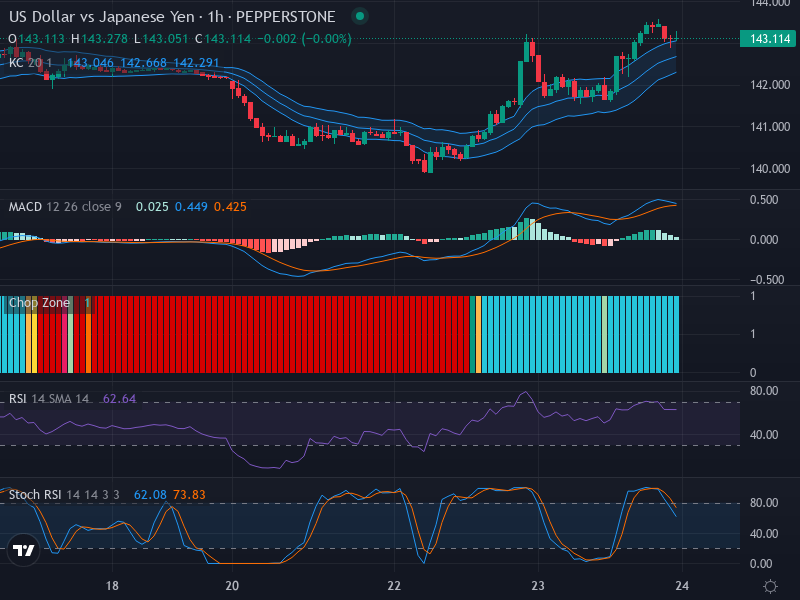
The currency pair of USD and the Japanese Yen currently exhibit a predominantly bullish momentum. Despite short-term retracements, the overall market direction of the USD/JPY remains upward, as evidenced by recent forex movements and key technical indicators. The yen is trading at a price point of 143.114 against the US dollar, as of the most recent data.
Technical Analysis
The forex chart displays a recent bullish engulfing pattern, signifying an upward trajectory for the US dollar against the Yen. However, caution must be exercised, as overbought conditions loom large, particularly as the RSI reading edges close to the 70 threshold, currently standing at 62.64. Furthermore, potential divergences in RSI could induce fluctuations in the strength of the bullish trend.
Resistance and support levels should be observed closely. At present, the resistance level is situated at 143.5, while the support is hovering around 142.5. These critical price levels could influence trading decisions in forthcoming sessions.
Market volatility appears to be rising, as suggested by the expansion of the Keltner Channels. Even though the chart reflects a bullish trend with the price being above the EMA 20 band, an expanding channel could mean higher chances of price swings.
On examining the Stochastic RSI, a potential bearish crossover advocates further prudence for long positions. Despite the current alignment of stochastic readings with the bullish momentum, reversals could be on the anvil, calling for diligent monitoring.
The MACD analysis also supports this viewpoint. With the MACD value (0.449) exceeding the signal line, the market leans towards a bullish sentiment. Nevertheless, keeping potential overbought conditions and the bearish Stoch RSI crossover in mind, traders should use discretion in their approach.
Conclusion and Trading Recommendations
While the picture painted by the technical analysis points towards a continued bullish trend for the USD/JPY currency pair, traders ought to remain vigilant for potential reversals or retracements. Given the approaching overbought conditions and the hint of a possible bearish crossover in the Stochastic RSI, new long positions should be undertaken with caution.
The neutral Chop Zone illuminates the possibility for a breakout; hence, close observation of the market movement is advised. Consequently, prudent risk management and well-planned trades aligned with individual trading strategies would be the most suitable course of action.
Trend Analysis by Time Frames
In combination with the above analysis, the following insights can be derived from different time frames:
- 1-Week Trend: The USD/JPY showcases a strong bullish long-term trend, with consistent higher highs and higher lows affirming upward momentum.
- 1-Day Trend: The daily chart confirms bullish sentiments but indicates some oscillation, suggestive of minor retracements amid bullish enthusiasm.
- 4-Hour Trend: Short-term movements are displaying signs of indecision; potential sellers may find opportunities as price approaches overbought areas likely influenced by fluctuations in market sentiment.
Potential Entry Points:
In light of the analysis:
- Buy Entry Point: 143.15 | Take Profit Point: 143.50 | Stop Loss Point: 142.80.
- Sell Entry Point: 143.00 | Take Profit Point: 142.70 | Stop Loss Point: 143.20.
Based on the current market dynamics, there is a higher likelihood of a Buy scenario occurring given the prevailing bullish trend, but traders should remain prepared for possible corrections.


