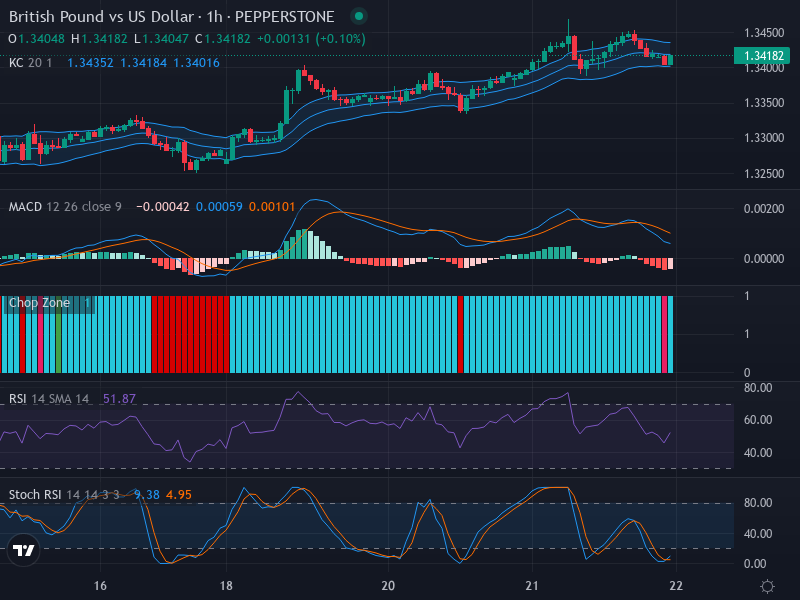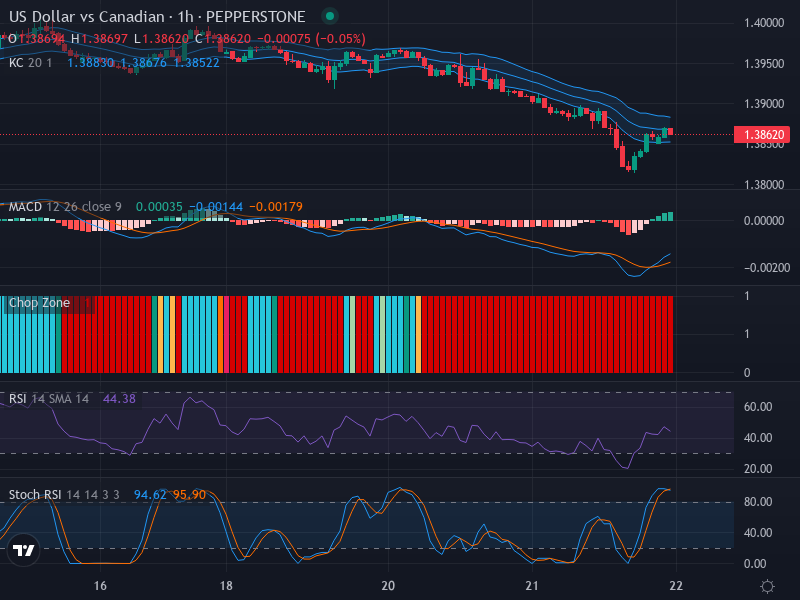
Euro Shows Promising Uptrend Against the US Dollar: An In-depth Forex Market Analysis – 22/05/2025
Tháng 5 21, 2025
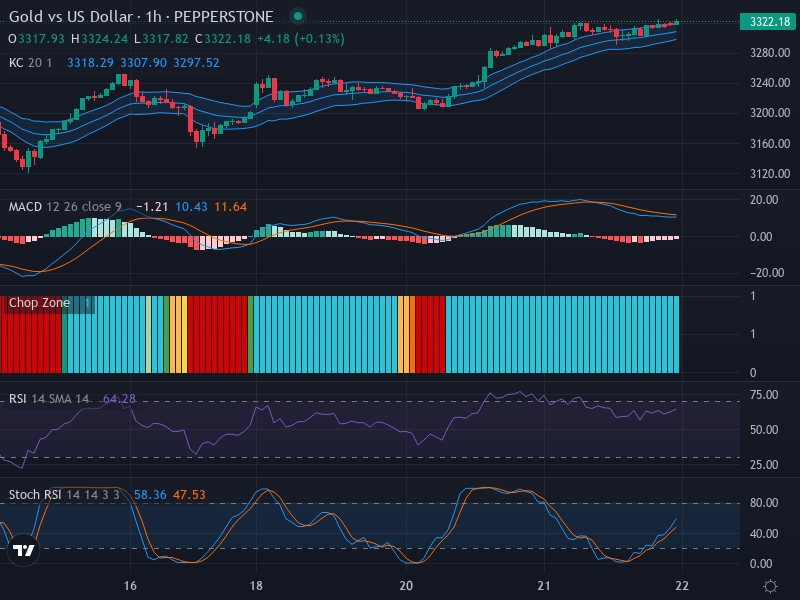
The Bullish Prospects in Gold vs US Dollar: Technical Outlook and Trade Considerations – 22/05/2025
Tháng 5 21, 2025Market Overview:
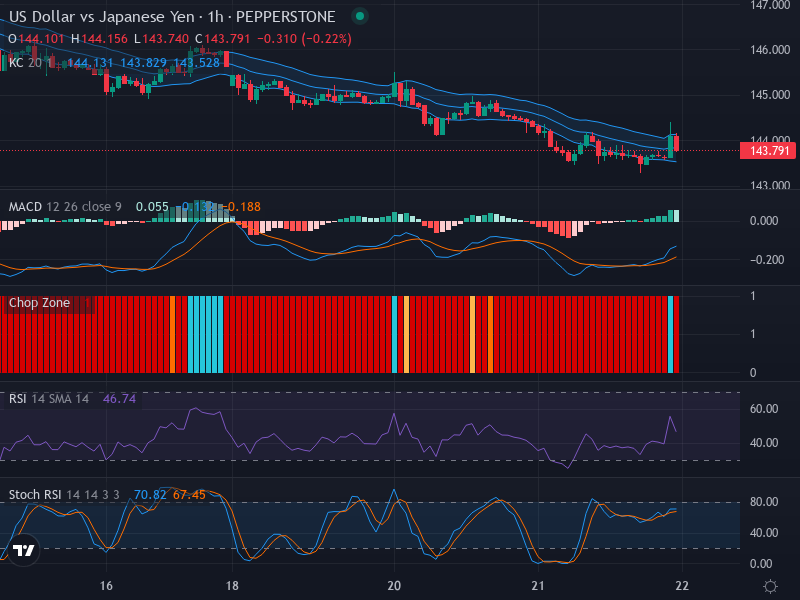
The current market landscape between the US Dollar (USD) and Japanese Yen (JPY) reveals a cautious and somewhat uncertain climatic environment, characterized by a noticeable pattern of lateral movements. The absence of any significant bullish or bearish indicators suggests a potentially strategic opportunity for risk-averse investors. These investors could recognize the pattern as an indication of a cautiously traded market with minor fluctuations around the current price of 143.791.
Technical Analysis:
Our thorough analysis begins with an examination of candlestick patterns, which suggests a horizontal trend rather than a clearly ascending or descending directional pattern. This scenario often paints a picture of a trading environment where there is an equilibrium between buying and selling forces.
Regarding potential price zones, close observations suggest an approaching support level near 143.500. This level may come into play if the currency pair experiences resistance at the top range of the Keltner Channel situated around 144.000.
The Relative Strength Index (RSI) further solidifies the neutral market sentiment with a value standing at 46.74, quite stable within the ‘neutral’ zone on the scale. This infers that the market isn’t confronting immediate pressure from overbought or oversold conditions.
Probing the Stochastic RSI provides an enhanced depth into the momentum aspects, signaling a slightly weak bullish acceleration. With the Stoch RSI K value currently at 70.82 and D value at 67.45, the market recently peaked above 80 before retracting, indicating a mild easing of the bullish momentum. A minor bearish divergence observed further signifies slight opposition to the previously ascending drive.
The Moving Average Convergence Divergence (MACD) reconfirms the market sentiment. There’s a noticeable bullish crossover with the MACD line at 0.055 surpassing the signal line at -0.188, implying potential bullish momentum; albeit, not dominantly persuasive.
Conclusion and Trading Recommendations:
In summary, the USD/JPY pair is currently navigating a cautious sideways movement pattern. For investors seeking to operate in this market, this could mean a series of strategic opportunities based on the resistance level near 144.000 and the support level at around 143.500.
Traders can potentially look to go short if the price bounces off the resistance level or go long if a retracement occurs near the support level. However, it is integral to observe and react to any future changes in the market’s momentum indicators.
Analysis of Time Frames:
In analyzing the 1-week, 1-day, and 4-hour time frames, the current trends can be summarized as follows:
- 1-week timeframe is exhibiting a sideways trend with no clear directional bias, suggesting limited potential for strong movements.
- 1-day timeframe shows a slight bearish sentiment as the recent peaks are being followed by lower lows.
- 4-hour timeframe indicates consolidation with minor upward pressure, hinting at potential buying opportunities near support levels.
Potential Entry Points:
Based on the analysis of indicators and market structure:
- Buy Entry Point: 143.600, Take Profit Point: 144.000, Stop Loss Point: 143.400.
- Sell Entry Point: 144.000, Take Profit Point: 143.500, Stop Loss Point: 144.200.
Considering the overall market behavior and imposed critical levels, it seems that the Buy scenario has a higher likelihood due to underlying support mechanisms, although vigilance on bearish signals is essential.