
Forex Technical Analysis Report: Insights for May 6, 2025 – 06/05/2025
Tháng 5 5, 2025
USD/CAD Forex Market: A Comprehensive Look at Consolidating Market Conditions – 06/05/2025
Tháng 5 5, 2025Market Overview
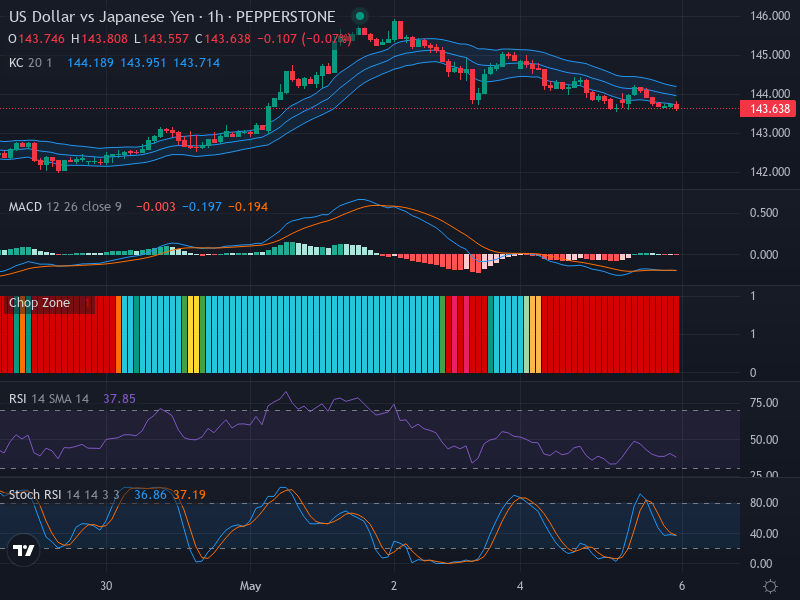
The USDJPY pair is presently exhibiting a downward trend, firmly embedded within its current sequence of lower-highs and lower-lows. The smaller bodies of the candlesticks suggest that the market has entered a consolidation phase, marked by low volatility. Traders are keenly observing potential retracement opportunities around the 143.800 level, a previous resistance that may reassert itself.
Technical Analysis
With a clear decreasing trend established, our analysis hinges on the Relative Strength Index (RSI), Stochastic RSI, and MACD. The RSI currently rests at 37.85, creeping close to the oversold territory. This suggests a potential entry point for buyers; however, it simultaneously reinforces the observed bearish context. Notably, there is no visible divergence between price movement and RSI, affirming the continuation of the bearish trend.
Next, we turn to the Stochastic RSI. Analyzing the K and D values, we find them in the 20-40 range, indicating persistent bearish sentiment, with no sign of a crossover that could signal a shift in momentum. Lastly, the MACD sits slightly below its signal line, indicating a bearish crossover. Although the negative bars of the MACD histogram represent ongoing downward pressure, their narrowing indicates a possible weakening of this momentum.
Conclusion and Trading Recommendations
Our comprehensive analysis leads us to a sustained bearish outlook for the USDJPY pair in the short term. The collective indicators, particularly the RSI, Stochastic RSI, and MACD, corroborate this view. Consequently, traders should contemplate selling positions or preparing to initiate short positions in the medium term. However, it is crucial to remain vigilant for retracement opportunities around the 143.800 level, which may provide a brief buying opportunity.
Time Frame Analysis
In the 1-week time frame, the trend remains definitively bearish, with no signs of reversal. The 1-day analysis confirms the continuation of this downward trajectory, while the 4-hour chart shows consolidation, potentially leading to a near-term pullback.
In terms of specific trading entries, we can delineate the following:
- Buy Entry: 142.500 | Take Profit: 143.200 | Stop Loss: 142.000
- Sell Entry: 143.800 | Take Profit: 143.000 | Stop Loss: 144.200
As per the analysis across the time frames, a Sell scenario appears more likely, given the prevailing bearish indicators, thus providing traders with a structured strategy for executing trades.


