
GBP/USD Analysis: Challenges Ahead for Upward Momentum
Tháng 5 6, 2025
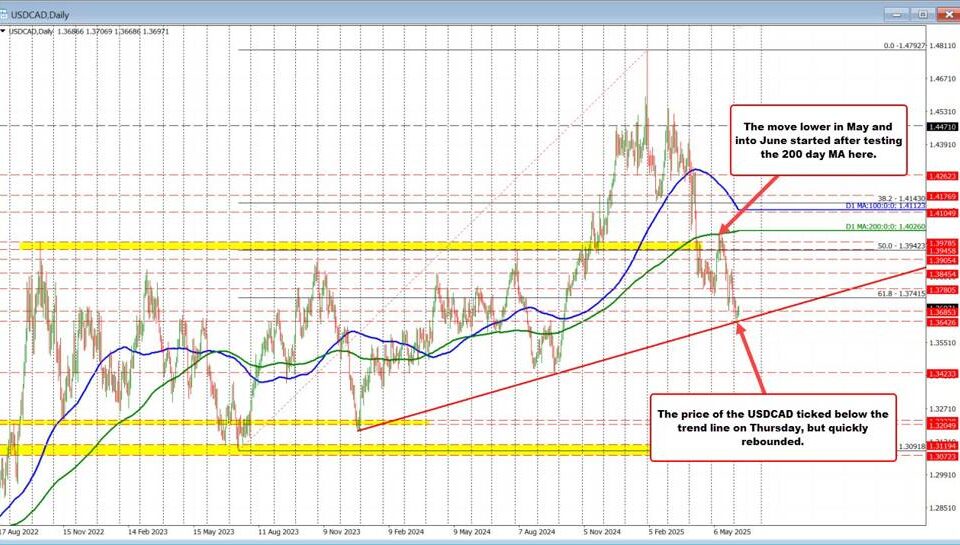
USDCAD Technical Analysis: Navigating Resistance and Support on May 6, 2025
Tháng 5 6, 2025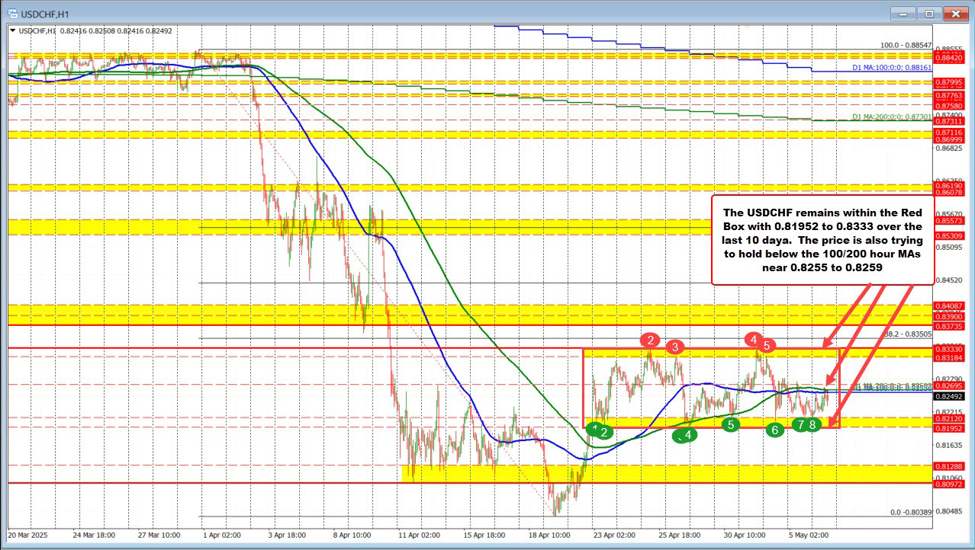
Technical Outlook for USD/CHF: Analyzing Key Developments (May 1-6, 2025)
The USD/CHF currency pair has demonstrated notable volatility and technical challenges in the first week of May 2025. Recent analyses suggest that trading activity is significantly influenced by key support and resistance levels, as well as overarching market sentiments. Here, we will delve into the recent price action, highlight the critical levels of interest, and review the market structure shaping the outlook for USD/CHF.
Resistance Struggles and Bullish Attempts
Throughout the week, the USD/CHF pair faced repeated rejections at resistance levels near 0.8333, with additional pressure from the 38.2% Fibonacci retracement level at 0.83505. These price points have effectively capped bullish attempts, indicating a prevailing bearish sentiment in the market. This consistent inability to breach these resistance levels suggests a lack of conviction among buyers and indicates that sellers have maintained control over the market dynamics.
As of May 5, there was a momentary breach above the 100-hour moving average (HMA) at 0.8257 and the 200-HMA at 0.8263. However, this breakout lacked sufficient momentum and could not be sustained, reinforcing the idea that bearish traders remain firmly in the driver’s seat. Such break failures often lead to increased selling pressure, adding to the challenges for those attempting to capitalize on upward price movements.
Identifying the Support Zone
In the current trading landscape, attention must be focused on the 0.8195-0.8212 range, a critical support zone that has held since late April. This area illustrates the market’s sensitivity to shifts in price, and any breach beneath this range could open the door to further declines in USD/CHF. Moreover, the establishment of this zone as a swing area underlines its significance in future trading sessions.
The Elliott Wave Perspective
From a technical analysis standpoint, the Elliott Wave theory provides additional insights into potential price movements. The current market structure indicates that the market may be in the midst of an orange wave 5 within a larger navy blue wave 1. This scenario suggests the possibility of a final bullish push before a significant correction occurs. Traders should note that the invalidation level for this pattern stands at 0.89168, highlighting the importance of monitoring price action in relation to this threshold as it could signal a more substantial trend reversal.
Current Technical Posture and Momentum Signals
As it stands, the current technical posture leans towards a bearish bias, with prices continuing to reside below the crucial HMA cluster. This positions traders to be cautious regarding any bullish momentum. Technical indicators, such as the MACD, EMA50 convergence, and RSI patterns observed on the H4 charts, point to a weakening upside strength, reinforcing the bearish outlook.
In summary, for USD/CHF, critical breakout levels are defined by 0.8195-0.8212 as Primary Support and 0.8257-0.8263 as Resistance. As traders continue to analyze market conditions through the lens of technical indicators and key price levels, staying informed about these parameters will be essential for navigating the prevailing trends in the currency pair. Understanding these dynamics can significantly aid traders in making informed decisions in the shifting landscape of forex trading.
For further insights into the current neutral trend in the forex market, particularly related to USD trading dynamics, you may find this analysis on neutral undertones between USD and CAD informative. Additionally, if you wish to explore GBP/USD’s neutral range and its market behavior, consider this blog post on GBP/USD technical notes and strategies. Lastly, for a technical analysis that touches on EUR/USD bullish momentum and its impact on broader dynamics, refer to this EUR/USD forex analysis.