Upward Bias Evident in USD/JPY Amidst Sideways Market Movement – 28/03/2025
Tháng 3 27, 2025
Analyzing the Bearish Tendencies in NZD/USD Market: A Comprehensive Review – 28/03/2025
Tháng 3 27, 2025Market Overview
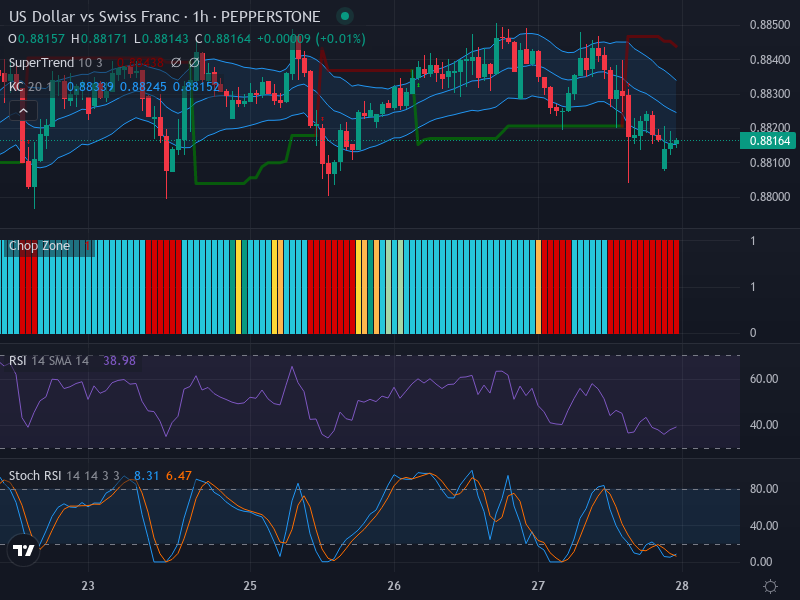
The forex market is witnessing an intriguing tug of war between the US Dollar (USD) and the Swiss Franc (CHF) on the hourly chart. Overall, the USD/CHF pair is delicately tilted towards the downside, exhibiting modest bearish tendencies. Nevertheless, an aura of market indecision is palpable, as depicted by the series of small-bodied candlesticks closing near the lower end of the range.
Technical Analysis
Diving deep into the technical strata of USD/CHF, the currency pair’s support and resistance levels are clearly discernible around the 0.8800 and 0.8830 zones, respectively.
On the Relative Strength Index (RSI) front, the market is flirting with the oversold region, clocking an RSI value of 38.98. While there’s no evident divergence between RSI and the price action, its proximity to the oversold domain signals a possible rebound – subject, of course, to corroborative cues from other indicators.
Turning attention to the Keltner Channels and Chop Zone, the price movement is captured near the lower boundary of the Keltner Channel. This positioning evidently reflects the bearish pressure acting on the USD/CHF pair. In terms of volatility, a moderate expansion of the Keltner Channels indicates an upshot in market unrest. Interestingly, the Chop Zone is unable to point at a strong accumulation zone, further underlining the prevailing market indecision.
Lastly, the Stochastic RSI analysis exhibits potential reversal indicators. The ‘K line’ and the ‘D line’ are sitting in the oversold ambit with values at 8.31 and 6.47, respectively. This condition could precipitate an upward drift if an affirmative crossover above the benchmark ’20’ occurs – an event traders are keenly watching for.
Conclusion and Trading Recommendations
Given the technical landscape, a cautious approach seems prudent for traders dealing with the USD/CHF pair. The market is in a precarious state – somewhat bearish yet indecisive – with potential for a pullback.
For conservative traders, waiting for a clear breakout with two consecutive candle closes outside the Keltner Channel may provide a more definitive signal. Further supportive evidence from RSI moving out of the oversold zone, combined with a positive crossover on Stochastic RSI, could solidify a bullish behavior.
However, if the resistance at 0.8830 holds firm, expect further bearish trajectory, and the support at 0.8800 could be tested. So, prepare your trading strategies accordingly.
Risk Disclaimer
Trading Forex involves a significant amount of risk. Past performance is not necessarily indicative of future results. The analysis provided here is based on the technical study of the recent market developments and should not be taken as a guarantee for future market behavior. Trade sensibly and keep your risk parameters in check.
One-Week Trend Analysis
The trend on the 1-week time frame is showing a slow downward movement influenced by market sentiments surrounding economic data releases.
One-Day Trend Analysis
On the 1-day chart, a slight bearish bias is evident as the price fluctuates near the lower part of established support levels.
Four-Hour Trend Analysis
The 4-hour time frame suggests indecision, with alternating bullish and bearish signals, causing a consolidative price action.
Based on the above analysis, traders should consider potential entry points on the 1-hour chart as follows:
- Buy Entry Point: 0.8810; Take Profit Point: 0.8835; Stop Loss Point: 0.8795.
- Sell Entry Point: 0.8790; Take Profit Point: 0.8770; Stop Loss Point: 0.8805.
In conclusion, considering the technical indicators, the possibility of a Buy scenario appears more likely, especially if momentum builds above the resistance level.