
USD/JPY: A Prolonged Downward Trend Amid Oversold Indicators – 06/05/2025
Tháng 5 5, 2025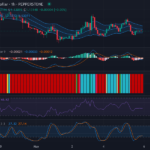
Neutral Momentum Holds Sway Over the Euro vs US Dollar Pairing – A Detailed Technical Analysis – 06/05/2025
Tháng 5 5, 2025Market Overview
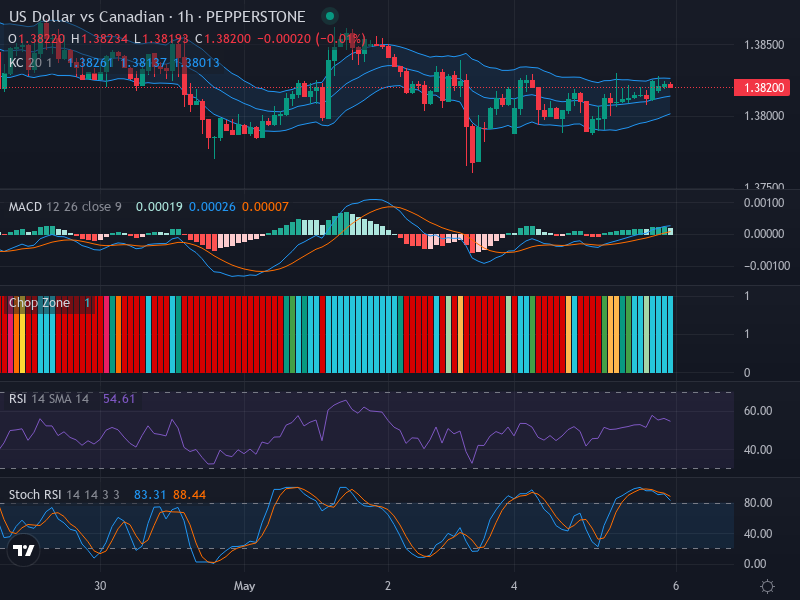
The USD/CAD currency pair is currently exhibiting a state of consolidation, as reflected by the existing price of 1.38200. A noticeable lack of pronounced market trend has characterized recent trading sessions, leading to lateral price movements. Small-bodied candlesticks on the chart are clearly portraying a state of market indecision, further underscoring the stagnant market conditions.
Technical Analysis
At this juncture, the USD/CAD market appears to be caught within the confines of two primary levels: the resistance at 1.38500 and the support level at 1.38000. The price has been oscillating between these two points, a typical characteristic of consolidating forex markets.
As we delve deeper into the indicator analysis, the Relative Strength Index (RSI) is currently placed at 54.61, effectively residing within the neutral zone. This resonates well with the ongoing sideline market narration, marking a lack of either immense buying or selling pressures.
The Stochastic RSI, however, paints an interesting picture. With the %K Line at 83.31 and the %D Line at 88.44, both lines are comfortably nestled in the overbought territory. This could potentially signal the onset of a market correction in the coming periods. Furthermore, an apparent crossover might be in the making, which can usher in a temporary price reversal.
The Moving Average Convergence Divergence (MACD) analysis provides additional insights. The MACD Line of 0.00019 is currently sitting below the Signal Line of 0.00026, projecting a marginally bearish sentiment. Nevertheless, signs of convergence are slowly surfacing, reducing the overall bearish hue. The MACD Histogram, exhibiting minor changes, further attests to the unimpressive market momentum currently dominating the USD/CAD pair.
Conclusion and Trading Recommendations
With no clear direction, traders must exercise caution while operating in the USD/CAD market. While the MACD and RSI are reflecting a lack of strong momentum, the Stochastic RSI suggests potential market corrections. These conditions mandate that traders keenly observe for significant price actions around the identified resistance and support levels and any crossover in the Stochastic RSI before making concrete decisions.
Analyzing multiple time frames reveals some insights:
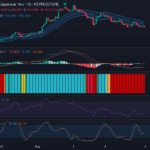
- For the 1-week time frame, the market is still stuck in a consolidation phase, with neither bulls nor bears taking control.
- In the 1-day view, the price action shows signs of potential reversal given the current overbought indicators.
- Observing the 4-hour time frame, the price continues to bounce between resistance and support, indicating a lack of momentum.
Considering these analyses, potential entry points are established on the 1-hour timeframe as follows:
- Buy Entry Point: 1.38150, Take Profit Point: 1.38450, Stop Loss Point: 1.38000
- Sell Entry Point: 1.38450, Take Profit Point: 1.38100, Stop Loss Point: 1.38500
In conclusion, while both scenarios are relevant, the analysis suggests a Buy scenario is more likely to occur based on current indications, particularly considering the potential correction hinted by the Stochastic RSI.


