

FEC Investigation: Rep. Jasmine Crockett’s Campaign Donations Under Fire
Tháng 4 15, 2025
Stock Market Spotlight: Netflix, Bank of America, Boeing, and Rocket Lab on the Rise
Tháng 4 15, 2025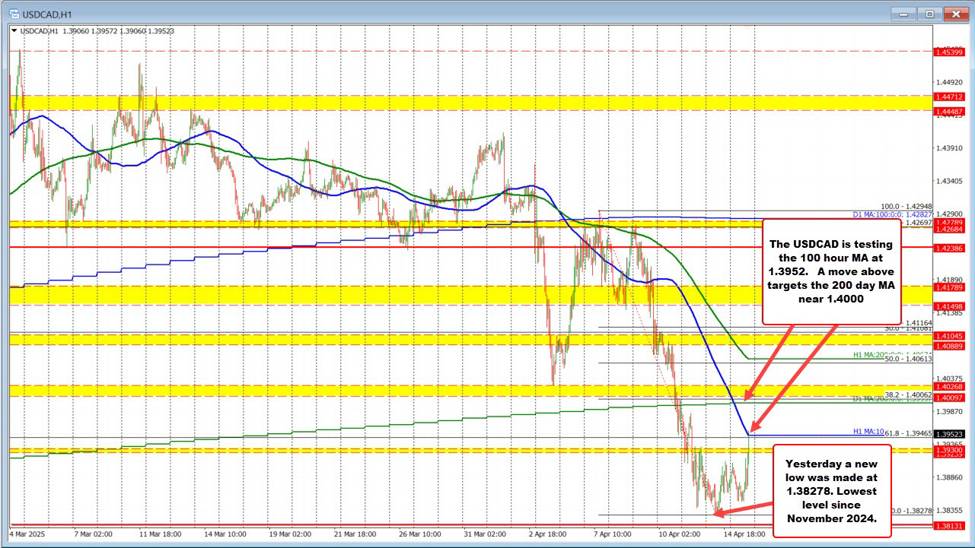
USD/CAD: A Critical Test Looms at the 100-Hour Moving Average
The USD/CAD currency pair has demonstrated a noteworthy rebound from its recent lows, igniting interest from traders and investors alike. However, as the pair approaches the pivotal 100-hour Moving Average (MA), the question arises: can it maintain this upward momentum? In this analysis, we take a closer look at both technical and fundamental factors shaping the future of the USD/CAD pair.
Technical Analysis: Navigating the Trend
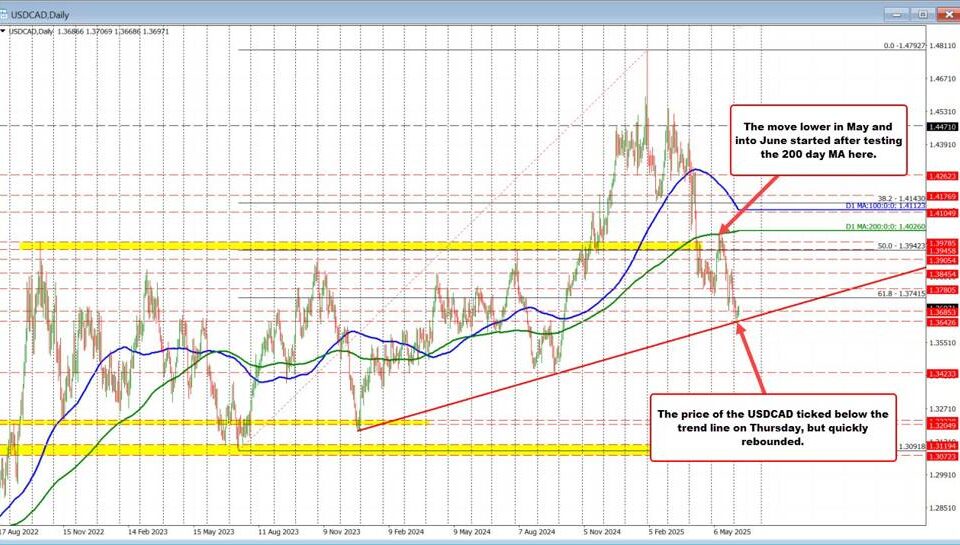
Currently, the USD/CAD is experiencing a bearish trend, having broken below an ascending trend line on the H4 time frame. This downward movement has been validated by the price action, which indicates a persistent decline. However, encouraging signs of a potential short-term bullish correction have emerged. Divergence between the price action and the Relative Strength Index (RSI) suggests that the selling pressure may be easing. Additionally, the MACD histogram reveals a weakening bearish momentum, hinting at possible upward shifts in the near future.
In terms of support and resistance levels, critical thresholds are established, which traders should closely monitor. The first significant support level is located at 1.38135, corresponding with the 61.8% Fibonacci retracement level, followed closely by 1.3770. On the resistance side, traders should pay attention to 1.39645, where the 50% Fibonacci retracement level intersects with the Exponential Moving Average (EMA) 21. Additionally, the 1.41155 resistance level corresponds with the 38.2% Fibonacci retracement, providing significant barriers to an upward movement.
As the USD/CAD approaches the 100-hour MA, this moving average acts as a crucial test point for the pair’s rebounding efforts. Success in breaking above this level might pave the way for further gains, while failure to overcome it could invite renewed selling pressure. The forex market is currently experiencing a neutral trend between the US Dollar (USD) and Canadian Dollar (CAD), characterized by indecision and low volatility as price fluctuates around the middle of the Keltner Channel. Key levels to watch for potential movements include 1.4315 and 1.4270, suggesting a cautious ‘wait and see’ approach until clearer trends emerge.
Fundamental Analysis: Economic Indicators at Play
On the fundamental front, the upcoming economic data from Canada will be essential in shaping the USD/CAD landscape. Key reports such as housing starts, Consumer Price Index (CPI) metrics, and manufacturing sales are set to be released soon. These statistics will provide critical insights into the health of the Canadian economy, potentially influencing the Bank of Canada’s monetary policy and subsequent interest rate decisions.
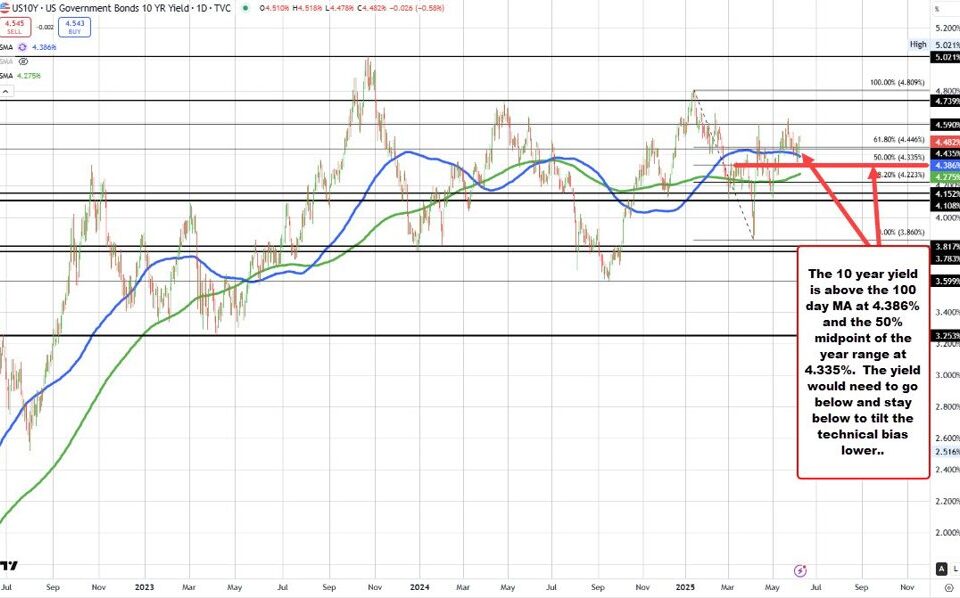
Moreover, the influence of U.S. economic developments cannot be understated. Statements from members of the Federal Reserve and upcoming U.S. economic indicators could trigger fluctuations in USD/CAD, adding another layer of complexity for traders to navigate.
Wave Analysis: Looking Ahead
In recent analyses, some experts interpret the current bearish phase within a broader WXY pattern. This viewpoint suggests that while there have been downtrends, they are part of a more extensive decline that will see intermittent pullbacks. This outlook indicates that traders should adopt a cautious approach, as the dynamics of the USD/CAD pair may shift rapidly based on a confluence of technical cues and fundamental news releases.
In conclusion, while the USD/CAD pair displays early signs of recovery, it faces a decisive moment at the 100-hour Moving Average. Both technical resistance and forthcoming economic announcements suggest a highly volatile environment. Traders must remain vigilant and adaptable, ready to seize opportunities or mitigate risks as the situation evolves.