
The GBP/USD Pair Showcases Strength: Time to Buy or Await Correction? – 29/04/2025
Tháng 4 28, 2025
Bullish Momentum Building: Gold Vs US Dollar Analysis – 29/04/2025
Tháng 4 28, 2025Market Overview
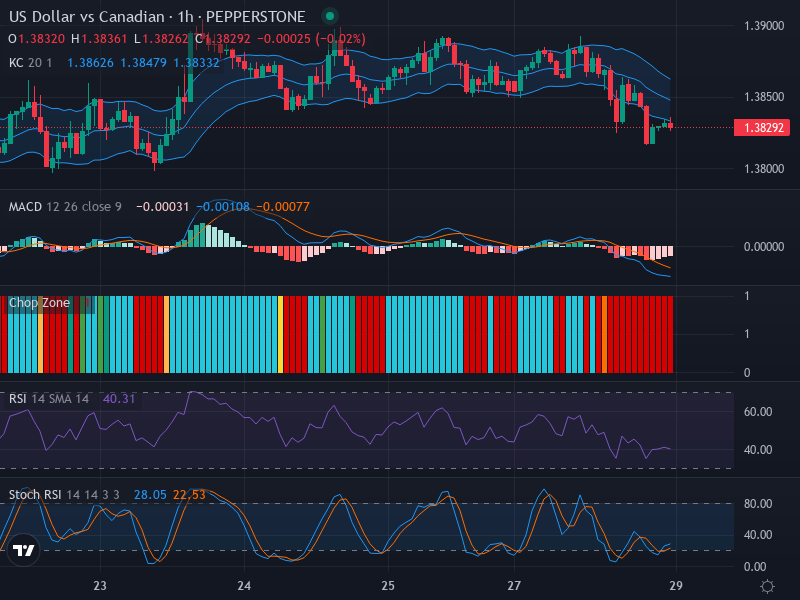
At present, the US Dollar has shown a lean towards a bearish trajectory against the Canadian Dollar (USD/CAD), as observed from the technical indicators within the Forex market. The current price stands at approximately 1.38292, and the currency duo has major signals pointing towards a continued downward direction.
Technical Analysis
A careful examination of the candlestick patterns reveals an ongoing downward trend as characterized by the recent surge of bearish candles. The potential for a market retracement is probable around the middle Keltner Channel’s area at 1.3845. This juncture could provide a swing point, depending on the market’s reaction and future candlestick formation.
The market’s current disposition is further corroborated by the Relative Strength Index (RSI), which records a reading of 40.31. This can be described as neutral to slightly oversold. The downward trajectory of the RSI signals a prevailing bearish momentum, with no notable divergences detracting from the trend.
Furthermore, an assessment of the Stochastic RSI reveals that both its K and D lines stand at 28.05 and 22.53, respectively. These readings fall into the oversold region, suggesting the possibility of an imminent directional shift if a crossover occurs.
From the perspective of the Keltner Channels and Chop Zone analysis, the currency pair’s price is predominantly hovering below the middle band. This maintains the primary trend’s bearish sentiment. However, concurrently, a high degree of disorder is displayed by alternating red and cyan bars, which denotes the presence of market volatility and an absence of a definitive breakout pattern.
Lastly, the Moving Average Convergence Divergence‘s (MACD) analysis reflects a bearish crossover, with MACD positioned below the signal line. Despite this, the histogram indicates a decelerating downward momentum, which may hint towards upcoming trend changes.
Conclusion and Trading Recommendations
With respect to the 1-week outlook, the USD/CAD pair exhibits potential for further bearish activity. However, traders are advised to watch for any potential bullish reversals due to the imminent oversold conditions indicated by RSI and Stochastic RSI, as well as the slowdown in downward momentum suggested by the MACD histogram.
Investors should observe the potential retracement zone around 1.3845 for crucial market turning points. Traders could wait for trading confirmations during these zone areas before executing buy or sell orders to minimize risk. It is particularly recommended to monitor the crossover of the Stochastic RSI’s K and D lines vigilantly.
Trading Scenarios
- The 1-week time frame indicates a continuation of bearish activity, suggesting further downward movements may occur.
- The 1-day time frame displays fluctuating prices, with potential for brief bullish retracements before continuing downward.
- The 4-hour time frame reveals a consolidation phase, highlighting the necessity of patience for clearer directional indicators.
Based on this analysis, potential entry points are:
- Buy entry point at 1.3840, with a take profit target of 1.3870 and a stop loss at 1.3820.
- Sell entry point at 1.3815, with a take profit target of 1.3785 and a stop loss at 1.3835.
After evaluating these indicators, a Sell scenario appears more likely to occur, given the current bearish momentum and market conditions.


