Navigating the UK Job Market: Insights into Hiring Trends and Opportunities
Tháng 5 11, 2025
EUR/USD: Potential Short-term Reversal Amid Prevailing Downward Trend – 12/05/2025
Tháng 5 11, 2025Market Overview:
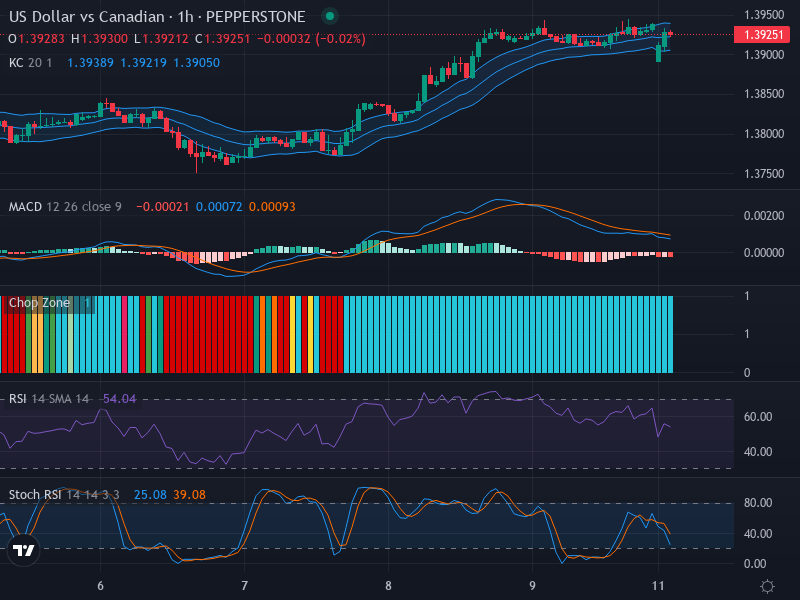
The US Dollar against the Canadian Dollar (USD/CAD) depicts a currently restrained lateral movement, with a tilt towards an upward bias. Today’s closing price stands at 1.39251. The market has seen indecisive price action with some brief periods of consolidation. A more definitive trend may establish itself if the pair breaks either the 1.39500 resistance levels for an upward trend or breaches the 1.39000 support level for a significant downward push.
Technical Analysis:
Based on our analysis of recent candlestick patterns, we observe consolidation with a lack of any distinctly strong reversal or continuation signals in the trend’s trajectory. The sideways trend finds a corresponding echo in the Relative Strength Index (RSI), with a value at 54.04, well within the neutral zone, without indicating overbought or oversold market conditions.
The stochastic RSI tells a similar story, with the K line having recently crossed below the D line—a bearish signal—but hovering near the oversold level, suggesting potential for an upward reversal. On the other hand, the MACD shows a recent bearish crossover, with a negative histogram value that also reveals weak bearish momentum, suggesting the observed lateral trend can continue in the absence of a substantial catalyst.
Conclusion and Trading Recommendations:
This analysis evidences an overall neutral to weak bearish sentiment for USD/CAD, characterized by its current sideways trajectory. While both RSI and Stochastic indicators reveal a non-committal overview, the MACD indicates a slight bearish inclination. It’s a cautious situation that warrants observant caution from traders.
Considering the analysis over multiple time frames:
- In the 1-week time frame, the market shows signs of indecision, reflecting a sideways trend.
- The 1-day time frame indicates a slight bearish pressure, but the momentum remains weak.
- On the 4-hour time frame, there are minor fluctuations but no strong directional movement.
Potential entry points based on the analysis are as follows:
- Buy Entry Point: 1.39500, Take Profit Point: 1.40000, Stop Loss Point: 1.39200.
- Sell Entry Point: 1.39000, Take Profit Point: 1.38500, Stop Loss Point: 1.39250.
Given the current technical indicators and market setup, a Buy scenario appears more favorable, particularly if the price breaks above the key resistance level of 1.39500. However, traders should remain vigilant and adapt to incoming market signals.