
Analysis of the Euro vs US Dollar: Preparing for a Potential Short-Term Reversal – 09/05/2025
Tháng 5 8, 2025
Prolonged Bearish Trend for Gold/USD Pair: Breaking Down the Latest Technical Indicators – 09/05/2025
Tháng 5 8, 2025Market Overview
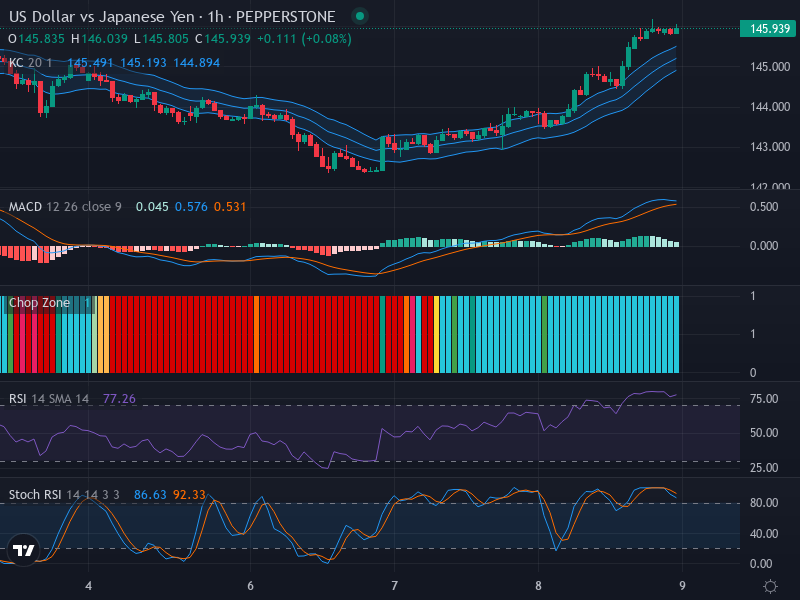
The US Dollar to Japanese Yen (USD/JPY) currency pair is showcasing an impressive upward momentum, highlighted by a series of bullish candlesticks. Currently, the pair trades at 145.939, maintaining a clear northward direction. Nonetheless, traders should be cautious of a potential resistance zone looming near the 146.500 level, which may present a significant barrier to further advancements in price.
Technical Analysis
Within the candlestick analysis, there are no obvious bearish reversal signals, indicating a possible continuation of the prevailing uptrend. Still, it is important to brace for potential volatility around the 146.500 mark, where selling pressure is likely to intensify.
The Relative Strength Index (RSI) currently stands at 77.26, suggesting an overbought market scenario. While this high RSI value confirms the ongoing bullish trend, it also raises awareness of excessive optimism, which could prompt a temporary retracement or consolidation in the near term. Moreover, the absence of divergence between the RSI and price movement reinforces the idea that price action is in sync with market momentum.
When examining the Stochastic RSI, upward momentum is indicated with a K value at 86.63 and a D value at 92.33, supporting the bullish sentiment. However, given that these values are deeply entrenched in overbought territory, a cautious approach is warranted due to the likelihood of a short-term correction.
The Moving Average Convergence Divergence (MACD) analysis reveals a MACD line at 0.576 and a signal line at 0.531. This confirms that buying pressure is currently greater than selling pressure. However, their closeness suggests a potential crossover in the near future, particularly if a bearish crossover occurs.
Conclusion and Trading Recommendations
Analyzing the current technical indicators and candlestick patterns, the USD/JPY pair is clearly reflecting solid bullish sentiment. This is supported by consistent bullish candlesticks on the chart along with indicators confirming this trajectory. Nevertheless, the overbought signals from both the RSI and Stochastic RSI advocate prudence, indicating there might be short-term corrections ahead.
Traders should monitor the 146.500 resistance level vigilantly, as this may significantly influence the course of the pair’s bullish journey. Additionally, the likelihood of a bearish MACD crossover implies that a cautious approach towards buying is recommended.
When considering the trend across different time frames, analysis reveals:
- 1-Week Trend: Continued bullish momentum on higher time frames, affirming the overall upward trend.
- 1-Day Trend: Signs of consolidation developing, with resistance at 146.500.
- 4-Hour Trend: Increasing selling pressure imminent as indicators begin to show signs of overbought conditions.
In light of this analysis, potential entry points include:
- Buy Entry Point: 145.800, Take Profit Point: 146.200, Stop Loss Point: 145.500.
- Sell Entry Point: 146.600, Take Profit Point: 145.800, Stop Loss Point: 146.900.
Conclusively, the analysis suggests that while a Buy scenario remains appealing in the short term due to current bullish momentum, traders should remain vigilant of impending resistance and the risk of potential short-term corrections.


