
A Comprehensive Analysis of the Bullish Surge in GBP/USD – 21/04/2025
Tháng 4 20, 2025
USD/JPY Analysis: Strong Downward Trajectory Witnesses an Oversold Market – 21/04/2025
Tháng 4 20, 2025Market Overview
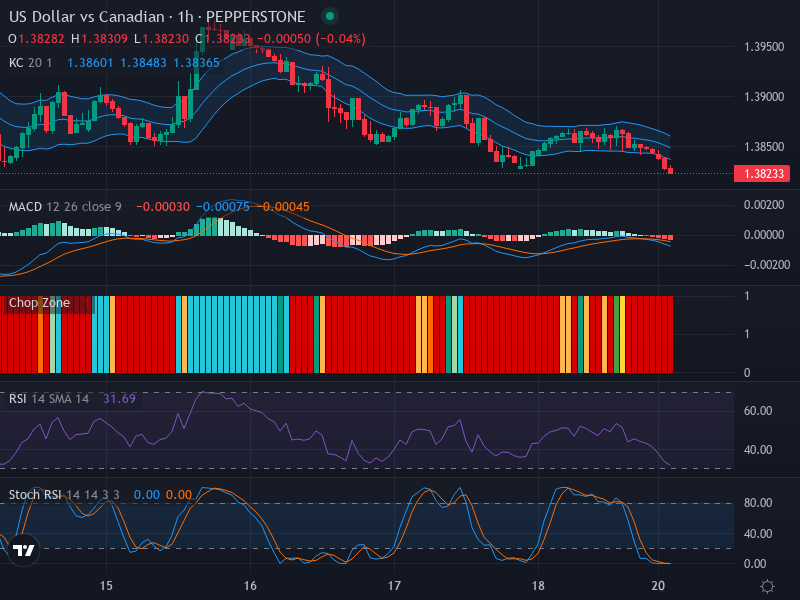
The US Dollar (USD) vs Canadian Dollar (CAD) forex pair is currently treading in a downward trend, as witnessed on the 1-hour chart. At the time of this analysis, it was trading at 1.38233, with several indicators pointing toward a potential reversal. Let’s delve into a detailed technical examination to highlight critical points surrounding the market state, possible price actions, and what Forex stakeholders need to anticipate.
Technical Analysis
In the first glance, the market trajectory pointed downwards with the presence of multiple bearish candles. Noticeably, there were no persuasive reversal patterns, such as bullish engulfing or hammer, marking the continuation of a bearish scenario. Despite the dominant trend, the price action suggests a possible retracement to the upper level of the Keltner Channel bands, around 1.38400, if a significant market support level forms.
The Relative Strength Index (RSI), currently at 31.69, is tipping toward oversold conditions. Such a market positioning traditionally suggests potential for a reversal or at least a consolidation phase. This potential reversal aligns with the prospects for support formation, unifying two different analytical methods.
The Keltner Channels further validate the bearish sentiment, with the price concurrently residing below the middle band. This placement underpins the ongoing downward trend. Alongside, the channels indicate a condition of moderate market volatility that shows some signs of a possible contraction. The Chop Zone, exhibiting a range of red bars, highlights the market may be stationed in a consolidation period, further fortifying the prospects for a potential breakout.
The Stochastic RSI is another tool that underpins the oversold state of the market, with both K and D values at 0. Although no crossovers are present at this time, a sustained low-valued reading might suggest a move towards correction if market conditions adjust.
Lastly, the Moving Average Convergence Divergence (MACD) analysis also leans towards signs of potential reversal. While the MACD line and signal line are rather negative, a developing convergence could indicate an imminent turnaround if confirmed by further market action. The falling histogram momentum is also suggestive of the current downward trend, hence keeping the outbreak potential alive.
Conclusion and Trading Recommendations
In conclusion, the USD/CAD pair is navigating within a bearish outlook in the near term. However, various technical indicators, such as RSI, MACD, and Stochastic RSI, are converging towards the possibility of a market reversal, signaling traders to prepare for a change in trend direction.
Traders should keep a close eye on the 1.38400 level, which could act as a critical resistance-turned-support level, and the evolving behavior of the MACD lines. For now, it would be prudent to adopt a cautious approach and wait for further confirmatory signals before initiating a position.
Trend Analysis by Time Frame
- 1-Week Time Frame: The weekly chart remains in a bearish trend, indicating continued selling pressure.
- 1-Day Time Frame: The daily chart shows signs of potential support forming, hinting at a possible reversal.
- 4-Hour Time Frame: The shorter timeframe indicates consolidation, pointing towards possible range-bound trading before a breakout.
Based on the analysis of these indicators and timeframes, potential entry points at the 1-hour time frame for traders can be identified. For a Buy entry point, traders may consider entering around 1.38400, with a Take profit target set at 1.38700, and a Stop loss point at 1.38200 to manage risk. For a Sell entry point, an entry can be sought at 1.38000, with a Take profit at 1.37650, and a Stop loss at 1.38100 to limit potential losses.
Given the current market analysis, the likelihood of a Buy scenario may be more favorable if key resistance levels at 1.38400 can be broken sustainably. However, traders must remain vigilant regarding market conditions and continue to monitor the evolving indicators.


