
Understanding Trump’s Bold Shift in U.S. Trade Policy: A Deep Dive into New Tariffs
Tháng 4 9, 2025
Sideways Sentiment Lingers for EUR/USD: A Comprehensive Technical Analysis – 10/04/2025
Tháng 4 9, 2025Market Overview
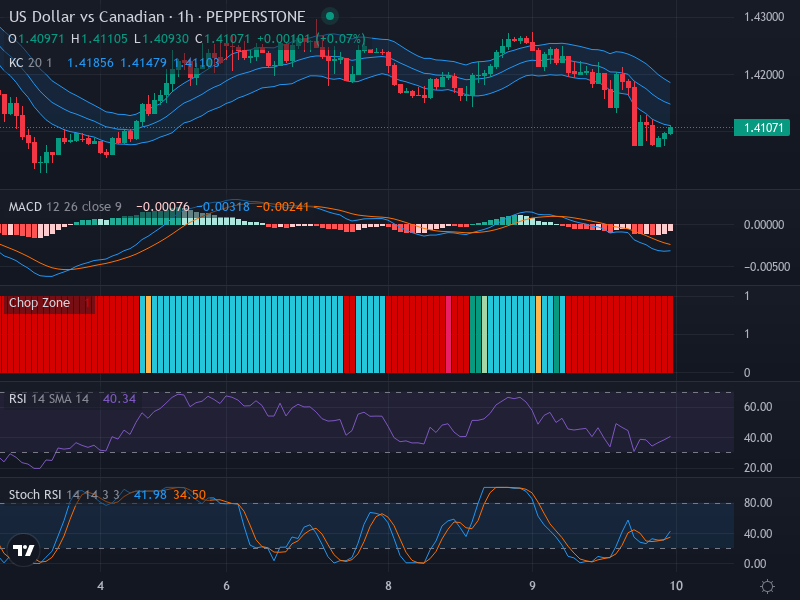
The USDCAD currency pair is currently demonstrating a downward trend, with small-bodied candlesticks suggesting an air of market indecision. Interestingly, there are hints of potential consolidation around the current price which might indicate a possible reversal due to reduced bearish momentum. Investors and traders alike should keep a keen eye on this currency pair as a possible shift in the market sentiment might be underway.
Technical Analysis
Looking at the candlestick patterns, we notice a slew of small-bodied candles with subtle wicks, denoting a sense of uncertainty in the market. This indicates that traders are yet to make a decisive move which could swing the trend clearly in one direction or the other. However, there is a detectable undercurrent of a downward trend currently dominating the market dynamics.
Regarding key price levels, our analysis identifies resistance around the 1.41856 mark and support near the 1.41071 level as crucial. These zones present potential areas of market confrontation where retracement or breakout events could occur, therefore, they warrant close monitoring.
The Relative Strength Index (RSI) shines a light on the market condition which appears to be neutral to slightly oversold, given the RSI value stands at 40.34. The RSI lends further support to the prevailing downward trend, however, it also suggests scope for potential stabilization or reversal as the indicator nears oversold territory. Continued monitoring of the RSI is necessary to gauge if these early signs of reversal materialize into actions from the market participants.
Further, the Stochastic RSI reveals that the K line stands at 41.98, crossing over the D line at 34.50. This recent crossover infers recovery from oversold levels, which may indicate a potential short-term reversal, reinforcing our initial observation.
The Moving Average Convergence Divergence (MACD) analysis reveals a slight crossover with the MACD line (-0.00076) slightly under the Signal line (-0.00318), implying weak bearish momentum. The histogram’s decreasing bearish momentum coincides with the weak moving averages crossover and hints at a possible trend reversal or a slowdown at least.
Conclusion and Trading Recommendations
In analyzing the trend across different time frames, we observe the following:
- 1-week time frame: A persistent downward trend is evident, marked by tightening consolidation.
- 1-day time frame: Signs of weakening bearish momentum suggest potential for short-term stabilization.
- 4-hour time frame: Small-bodied candlesticks reflect indecision, indicating that traders are awaiting further signals.
Considering the analysis, potential entry points are suggested:
- Buy Entry Point: 1.41200, Take Profit Point: 1.41600, Stop Loss Point: 1.40900.
- Sell Entry Point: 1.41700, Take Profit Point: 1.41300, Stop Loss Point: 1.42000.
Based on the current indicators and analysis, a Buy scenario appears more likely as the market exhibits signs indicating a potential short-term reversal. However, traders should remain vigilant for stronger trends and signals before committing to any positions.
Risk Disclaimer
Please bear in mind that this analysis represents potential market dynamics based on historical data and technical indicators. Forex trading carries a high level of risk. Therefore, no decision should be made solely based on this analysis. It is crucial to take into account market news, local economics, and your personal risk tolerance. All financial decisions should be made consciously, taking into a consideration possible financial losses.


