
Decoding the Bearish Tendency: A Technical Examination of EUR/USD – 05/04/2025
Tháng 4 4, 2025
Trump Considers Extending TikTok’s U.S. Operation: What’s Next for the Viral App?
Tháng 4 4, 2025Market Overview
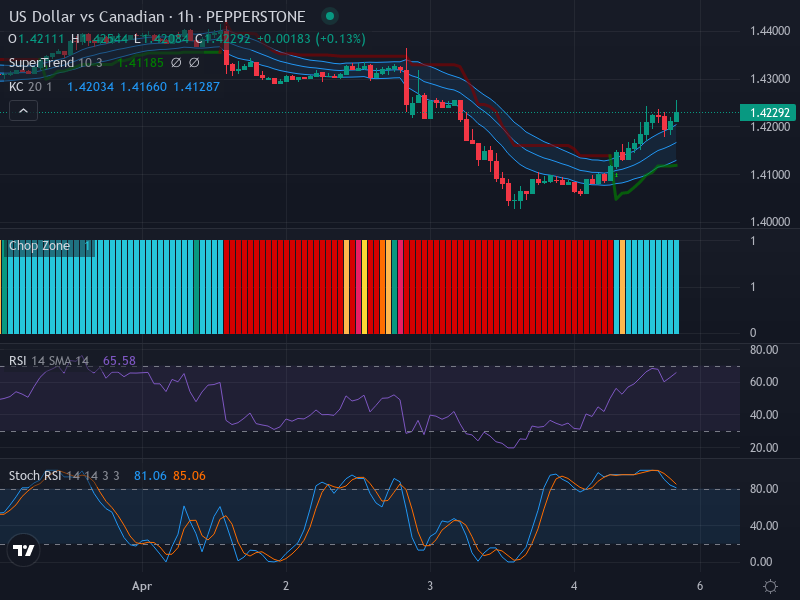
In the Forex market landscape, the recent price trend of the US Dollar (USD) against the Canadian Dollar (CAD) seems to point towards a recovery phase. Previously diverging lower in a bearish momentum, the USD/CAD pair is now demonstrating an upward momentum underscored by smaller, bullish candles.
Technical Analysis
Notwithstanding the apparent bullish resurgence, the pair is fast approaching a crucial resistance point near the 1.4290 mark, which aligns with previous support and resistance levels. Traders would do well to keep a close watch on this level, anticipating potential price retracements as the market seeks to reassess the sustainable direction.
In lieu of Relative Strength Index (RSI), the market is rapidly approaching the overbought threshold with an RSI reading of 65.58. While currently complementing the upward momentum, this can also signal a potential reversal looming on the horizon if divergences occur, indicating a possibility of the bulls beginning to fatigue.
Substantiating this perspective, the Stochastic RSI paints a similar picture. With the K line at 81.06 crossing beneath the D line at 85.06, there’s plausible bearish divergence in sight suggesting a minimal pullback or a trend deceleration. This implication is in harmony with the RSI indications, further cementing the potential of an overbought market.
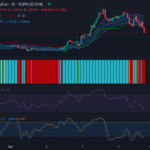
Utilizing Keltner Channels, the pair has wrapped the recent session with a close outside the upper channel, triggering the potential for a bullish price breakout. In complementary fashion, the Chop Zone indicator is veering from a predominantly red hue to blue, signifying a potential reduction in trend disorder and a potential tightening into a breakout.
From a Weekly Chart frame of reference, at a one-week view, the trend features lateral movement coupled with a slight bullish bias. However, the one-day trend displays a bullish continuation nearing a resistance level.
Conclusion and Trading Recommendations
Given the current marketplace milieu and taking into account all the technical indicators, the USD/CAD market appears to be leaning cautiously bullish. Despite signs of an upward continuation, the confluence of RSI, Stochastic RSI indicators, and upcoming resistance level warrant close monitoring for possible reversals or retracements.
Traders may want to consider waiting for clear signals, such as the RSI breaching the overbought territory or a trend reversal in the Stochastic RSI before placing any long or short positions.
Trend Summary
- In the 1-week timeframe, the trend features lateral movement with a slight bullish bias, indicating a concrete need for caution as market direction remains uncertain.
- The 1-day timeframe displays a continuation of the bullish trend, approaching key resistance, suggesting potential exhaustion as the market nears reversal conditions.
- The 4-hour timeframe has shown shorter-term bullish characteristics, yet with rising fatigue in momentum indicators warning of imminent pullbacks.
Potential Entry Points
Considering the comprehensive analysis:
- Buy Entry Point: 1.4250 | Take Profit Point: 1.4350 | Stop Loss Point: 1.4200
- Sell Entry Point: 1.4290 | Take Profit Point: 1.4190 | Stop Loss Point: 1.4320
Considering the indicators and market conditions, a Sell scenario may be more likely as the market nears overbought levels and significant historical resistance. Validating this trend, traders should remain vigilant and ready to react.


