
GBP/USD: An Opportune Retracement Amid Dominant Upward Trend – 22/04/2025
Tháng 4 21, 2025USDJPY Forex Analysis: Sentiment-Based Market Prediction
Tháng 4 22, 2025Market Overview
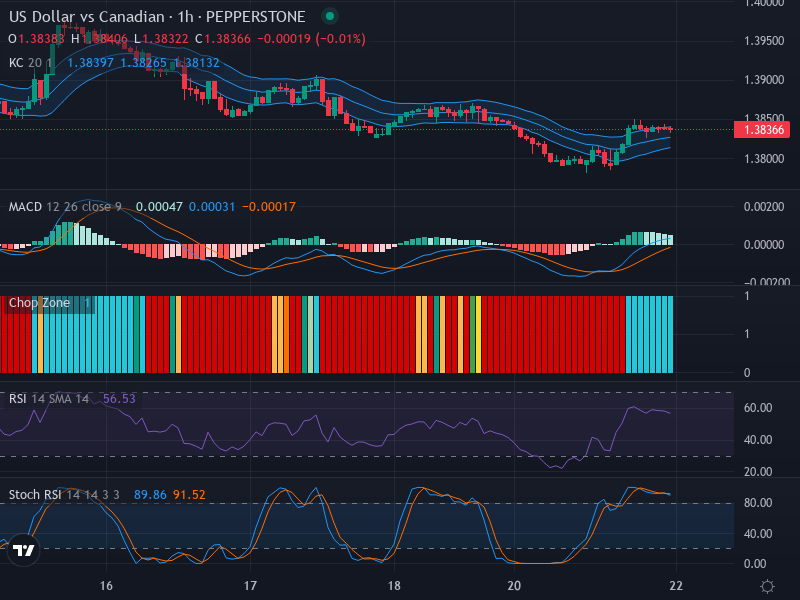
The US Dollar and Canadian Dollar pair (USD/CAD) is currently navigating the haze of a lateral market at a price of 1.38366. The trend in this range-bound market shows a balance of forces, with a slight bias towards an upward direction.
Technical Analysis
A deeper dive into the candlestick pattern reveals a market characterized more by indecision than a defined trend. The comparison of the low and high points presents a portrait of a potential standoff, underscored by the array of small-bodied candles scattered across the canvas. These candles transmit a narrative of slight bearish sentiment following the market’s cast-off from upper thresholds.
Marking the key contour lines on the chart, we find two significant zones — at 1.38500 and 1.38000. The persistent sluggishness might ignite a fallout, either in the form of a bullish breakout that surpasses the 1.38500 boundary, or a retracement favoring a bearish pullback that caps the lower level of 1.38000.
The Relative Strength Index (RSI) reinforces this sideline narrative with a reading of 56.53 — a neutral stance. Though it flirts with the edge of the overbought domain, the RSI is holding its ground within acceptable limits.
The Stochastic RSI K and D values (89.86 and 91.52 respectively) deliver an additional layer of complexity. The K line nudges slightly below the D line, interestingly preparing for a short-term bearish shift. This potential shift gets support from the overbought conditions flagged by the high stochastic RSI figures.
The Moving Average Convergence Divergence (MACD) and Signal line readings, 0.00047 and -0.00017 respectively, unveil a bullish crossover. This positive scenario occurs with the MACD cruising above the signal line, suggesting a possible price uptick supported by this technical indicator.
Conclusion and Trading Recommendations
The USD/CAD’s dance around the current lateral movement belies an underlying tension. The ongoing struggle between the bulls and bears is palpable, but the technical indicators hint at a slow tilt towards a possible upward breakout or downward retracement. The guarded optimism from the MACD bullish crossover might inspire traders to take a ‘wait and see’ approach.
Analyzing the market across different time frames reveals the following:
- 1-Week Time Frame: The market displays a neutral trend with potential bullish forces building.
- 1-Day Time Frame: The trend remains sideways, signaling indecision among traders.
- 4-Hour Time Frame: There are hints of bullish sentiment, but volatility can lead to rapid changes.
From this analysis, potential entry points can be structured carefully. For a Buy entry, consider placing an order at 1.38550, with a Take profit point set at 1.39000 and a Stop loss point at 1.38300. For a Sell entry, a position can be initiated around 1.37950, with a Take profit point at 1.37500 and a Stop loss point at 1.38100. As indicated by the current market indicators, a Buy scenario appears slightly more favorable, but caution is still warranted as market conditions remain volatile.
Risk Disclaimer
Any trading decisions made in reliance on this analysis are undertaken at your own risk. Forex trading involves a significant degree of risk and may not be suitable for all investors. Note that past performance does not guarantee future results.


