
Cautious Optimism Surrounds Bullish Momentum Shift in GBP/USD: A Detailed Forex Analysis – 07/04/2025
Tháng 4 6, 2025
USD/JPY Technical Analysis – A Pending Reversal amidst Downward Trend? – 07/04/2025
Tháng 4 6, 2025Market Overview
The US Dollar (USD) against the Canadian Dollar (CAD) currency pair has recently displayed an upward trajectory following a period of significant decrease. This observed bullish trend signifies an ongoing recovery, presenting potential trading opportunities. The pair’s current market positioning reflects a neutral status, underlined by moderate volatility within the wider foreign exchange (Forex) market.
Technical Analysis
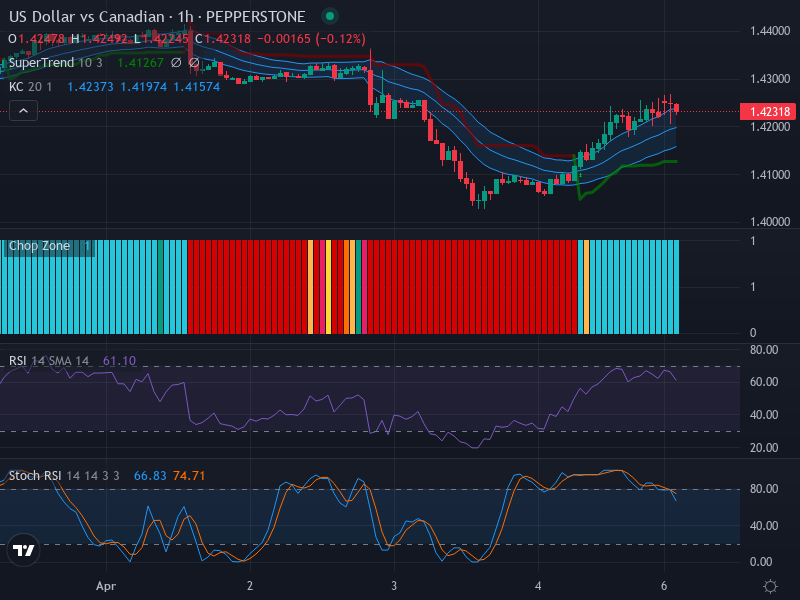
The USD/CAD has shown a notable bullish tendency following a notable downward phase. By examining the Candlestick pattern, a series of rising candlesticks indicate a potential for short-term recovery. This price action is testing the Keltner Channel‘s median level, providing an important determinant of future market movements. A breakout from this position could strengthen the upward momentum, while a retracement maneuver may drive the price back to the lower band of the channel.
Further, the currency pair’s Relative Strength Index (RSI) is currently clocking at 61.10, suggesting a transition from the neutral ground towards an overbought zone. This increase in the RSI value generally indicates an upward price movement. However, the approach to the overbought area could signal a possible reversal, acting as a cautionary flag.
In correlation with the RSI, the Stochastic RSI (Stoch RSI) is also displaying crucial insight into potential market behavior. The K Line and D Line values currently stand at 66.83 and 74.71, respectively. The close proximity of the Stoch RSI to the overbought zone combined with a possible crossover indicates a looming downward correction. This correction may pose a challenge to the recent bullish price movements.
The use of Keltner Channels in this analysis adds another layer of insight. As the price tests the median value of the channel, it demonstrates a possible resistance against further upward price movements. The moderate expansion of the channels indicates the current volatility level of the pair.
The Chop Zone also paints an interesting picture of the pair’s behavior. The prevailing red color suggests sideways price action, indicating an accumulation zone. Traders should be on alert for a possible trading signal if the Chop Zone turns green.
Conclusion and Trading Recommendations
Despite upward price progression, the market positioning remains relatively neutral. Vital analyses such as the RSI and Stoch RSI point towards potential resistance and possible price reversal from the overbought zone. Meanwhile, the Chop Zone’s current state hints at an ongoing consolidation.
Investors should adopt a careful monitoring approach before making any trading decisions. A buy position may be advisable upon the continuation of bullish price movement and clear breakout from the middle of the Keltner Channel. Alternatively, a sell position may also be considered in case of a clear Stoch RSI crossover and price retracement back to the lower channel band.
Trend Analysis
- 1-Week Trend: The broader trend indicates a recovery phase, with bullish indicators supporting the upward movement after prior losses.
- 1-Day Trend: Short-term trends show signs of consolidation, with resistance levels being tested, hinting at an impending decision point.
- 4-Hour Trend: The mid-term analysis reveals a significant price bounce, but caution is warranted due to indicators suggesting potential reversal.
Potential Entry Points
Considering the overall analysis:
- Buy Entry Point: 1.3600, Take Profit Point: 1.3700, Stop Loss Point: 1.3550. This strategy anticipates continued upward momentum if the Keltner Channel median is breached and the bullish sentiment persists.
- Sell Entry Point: 1.3500, Take Profit Point: 1.3400, Stop Loss Point: 1.3550. This scenario expects a reversal if the Stoch RSI crosses over and indicates downward pressure.
Based on this analysis, the Buy scenario appears more likely to unfold initially due to existing bullish signals but requires caution as indicators suggest potential overbought conditions.


