
A Closer Look into the Bearish Trend: GBP/USD Forex Pair Technical Analysis – 13/05/2025
Tháng 5 12, 2025
Technical Overview of a Bearish Currency Market: A Keltner Channels and Stochastic RSI Approach – 13/05/2025
Tháng 5 12, 2025Market Overview
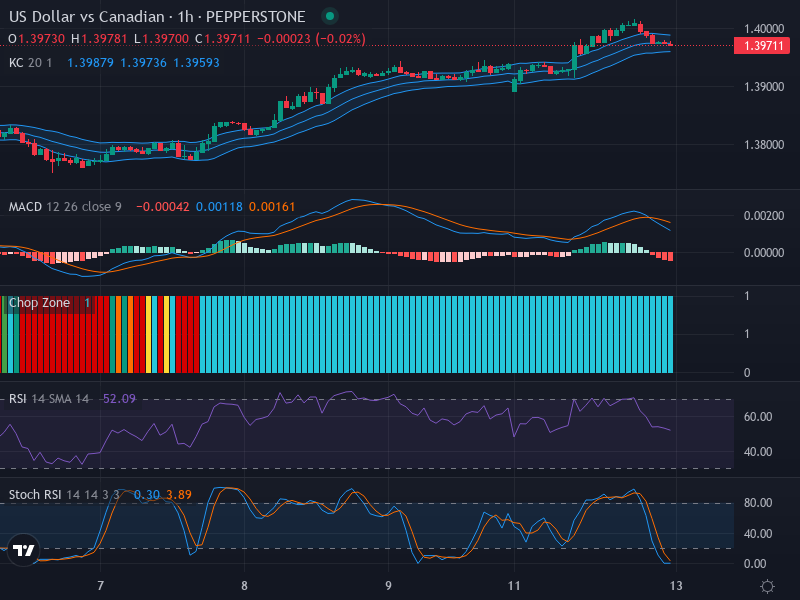
The FX market continues to captivate traders globally, with the US Dollar versus Canadian Dollar (USD/CAD) being a point of particular interest. At a present price point of 1.39711, analysts are tuned into the current influential factors and potential market movements. While recent trends might suggest a state of lateral movement with a slight downward pressure, traders are diligently searching for entry and exit points that could be advantageous in this uncertain market ambience.
Technical Analysis
Significant attention has been focused on the recent candlestick patterns within the USD/CAD chart. The market direction denotes a form of stability, indicating a lateral or sideways movement that aligns with the middle band of the Exponential Moving Average (EMA) 20, highlighting the market’s cool temperament. With the near absence of strong candlestick formations, traders are inclined to wait for signals prompted by movement within channel boundaries.
The next significant indicator is the lower Keltner Channel, which the prices are steering towards. The proximity suggests potential support zones may exist. Whether this leads to a trend reversal or continuation will be determined by an awaited breakout.
Indicators such as the Relative Strength Index (RSI) and Stochastic RSI (Stoch RSI) provide additional analytical context. With an RSI of 52.09, the market is presently neither overbought nor oversold, corroborating the sideways market trend and reflecting the price’s uncertain disposition. Meanwhile, the Stoch RSI has crossed below the 20 level, indicating potential oversold conditions and supporting the case for a price reversal.
Concerning market volatility, the narrow Keltner Channels suggest a currently low-volatility environment. Additionally, the chop zone analysis validates the notion of a lateral or sideways market trend, given the uniform presence of blue bars.
Conclusion and Trading Recommendations
In light of evidence rendering a relatively stable, albeit indecisive market condition for USD/CAD, prospective traders should maintain a vigilant and patient approach. Since the candlestick patterns lack definitive form, waiting for movement within channel boundaries could provide the best trading cues. Moreover, traders should eye the RSI and Stoch RSI indicators to capitalize on any signs of oversold conditions.
1-Week, 1-Day, 4-Hour Time Frame Analysis
In summary, the trends across various time frames are as follows:
The 1-week trend indicates a consolidating market, suggesting potential breakouts upon gaining sufficient momentum.
The 1-day trend reveals a slight bearish sentiment currently leading towards a potential bullish reversal, especially if support levels hold.
The 4-hour trend shows oscillations within a confined range, hinting at opportunistic entries as traders anticipate a breakout.
Potential Entry Points:
Buy Entry Point: 1.40000, Take Profit Point: 1.41000, Stop Loss Point: 1.39500
Sell Entry Point: 1.39000, Take Profit Point: 1.38000, Stop Loss Point: 1.39500
Based on the overall analysis, a Buy scenario appears more likely, particularly if bullish momentum develops with a breakout above the recent highs.


