
Japan’s CPI Insights: Navigating Stability Amid Global Trade Uncertainties
Tháng 4 17, 2025
GBP/USD Technical Analysis: A Possible Momentum Shift in the Offing – 18/04/2025
Tháng 4 17, 2025Market Overview
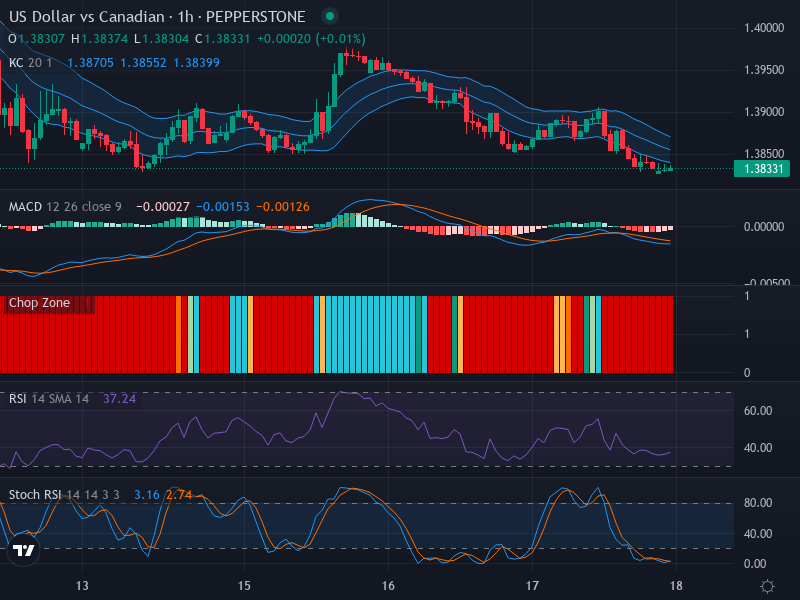
The US Dollar to Canadian Dollar (USD/CAD) exchange rate currently sits at 1.38331. A series of recent downward steps has dominated the hourly (1h) chart as bearish indicators overwhelmingly signify a strong downward trend for the pair.
Technical Analysis
Examination of the recent price action reveals a marked bearish trend. Lower highs showcased in the series of bearish candlesticks present in the chart suggest intensive selling pressure. The small-bodied candles, typically representative of a consolidation phase, confirm the current sideways market movement. Interestingly, a potential retracement zone has been identified around 1.38550, representing a promising swing high if bullish momentum issues a rally.
The Relative Strength Index (RSI), currently reading 37.24, validates the outlined downward trajectory, highlighting that the current market conditions are neutral, lingering toward oversold territory. Yet, there’s no strong evidence of divergence that might signal a distinct reversal from the established downtrend.
The Keltner Channels show the price consistently traversing beneath the midline, corroborating the prolonged downward trend. Furthermore, the Chop Zone renders thick red bars, a characteristic indicative of a sideways market, suggesting that a decisive breakout could be imminent. For a solid confirmation of the trend shift, traders should monitor for two consecutive closes outside the Keltner Channel, paired with a color change in the Chop Zone.
The Stochastic RSI (Stoch RSI), a powerful variant of the classic RSI, indicates a likely continuation of the bearish trend. The readings of the Stochastic RSI line (K) at 3.16 and the three-day average (D) at 2.74 suggest an oversold market condition. This might hint towards an impending reversal if a momentum shift occurs, offering the prospect of a relieving upward push.
The Moving Average Convergence Divergence (MACD) Line at -0.00027 further elucidates the prevailing trend. However, a comprehensive analysis would require insight from the value of the Signal Line as well.
Conclusion and Trading Recommendations
In the current market condition, the USD/CAD pair exhibits a dominant bearish momentum, with signs of consolidation and a potential trading opportunity lying at the retracement zone. As traders assess the situation for the 1-week, 1-day, and 4-hour time frames, they should be aware of the following:
- The 1-week trend indicates a strong downtrend with continued bearish pressure.
- The 1-day chart suggests potential consolidation near current levels, yet bearish sentiment remains dominant.
- The 4-hour perspective supports the trend with sellers maintaining control, reflecting continued downward momentum.
Based on the analysis of indicators and price movements, potential entry and exit points are outlined as follows: Buy Entry Point at 1.38500, with Take Profit at 1.39000 and a Stop Loss at 1.38200. Conversely, consider a Sell Entry Point at 1.38300, targeting a Take Profit at 1.37700 with a Stop Loss set at 1.38450. The prevailing market analysis suggests a Sell scenario is more likely to occur, given the substantial evidence of bearish momentum and market conditions.


