
Bullish Momentum on Horizon for Gold vs US Dollar – A Technical Outlook – 18/04/2025
Tháng 4 17, 2025
Mixed Signals: A Comprehensive Analysis of EUR/USD – 18/04/2025
Tháng 4 17, 2025Market Overview
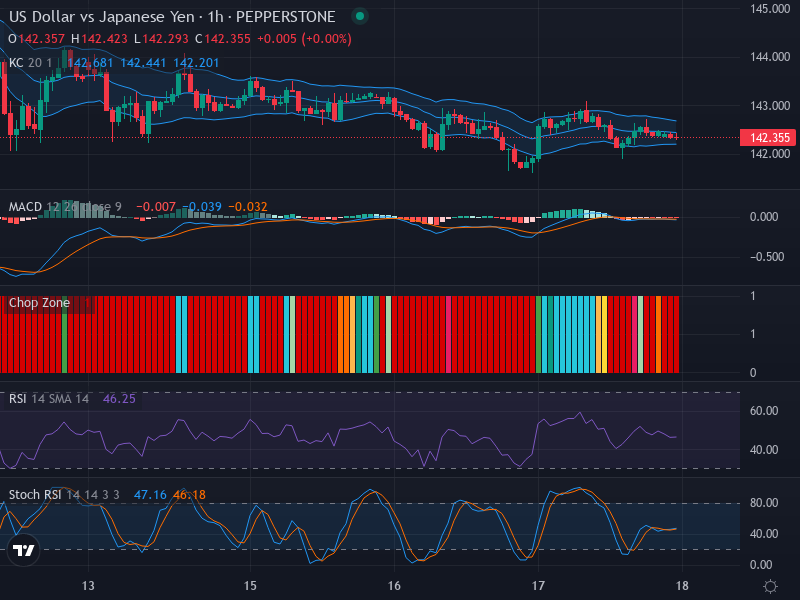
The Forex pair USD/JPY is currently characterized by a sideways movement, illustrating a state of market indecision. As of our last check, the pair’s price rests at 142.355. This relative calm indicates a market consolidation near the middle ground of the Keltner channels, creating opportunities for careful traders who are on the lookout for potential trend shifts.
Technical Analysis
Candlestick Patterns
At present, there are no significant bullish or bearish candlestick patterns displayed on the chart. The absence of key formations such as the bullish engulfing or hammer underscores the ongoing equilibrium between buyer and seller forces. This lack of directionality is further reflected in the market’s current state of pause, as portrayed by the consolidation near the median regions of the Keltner Channel.
Relative Strength Index (RSI) Examination
The RSI reading hovers in the neutral zone at 46.25, affirming the market’s indecisive stroll. This near-50 level suggests no immediate overbought or oversold conditions, correlating well with the ongoing sideways price action. Additionally, there are no significant divergences identified between the RSI and price movements, indicating a lack of signals for potential reversals or continuations soon.
Stochastic RSI Scrutiny & MACD Examination
The Stochastic RSI also echoes neutrality, showing K and D lines at 47.16 and 46.18 respectively, with no distinct crossovers to note. The MACD analysis presents a slightly more interesting scenario, displaying a bearish crossover with the MACD line at -0.007, positioned below the signal line at 0.039. However, the gradually declining histogram bars suggest a deceleration in downward momentum, hinting at a possible stall in the downtrend.
Keltner Channels and Chop Zone Indicators
In concordance with other technical indicators, the Keltner Channels reveal a status quo, with price action residing comfortably within its boundaries and lacking significant momentum. The Chop Zone further defines this narrative, continuously flashing red to indicate a non-trending market condition.
Conclusion and Trading Recommendations
In summary, the overall analysis highlights a lack of definitive price direction for the USD/JPY pair amidst a sideways market situation. Market participants may consider waiting for a stronger directional cue before establishing trading positions. Key candlestick patterns or notable crossovers in critical indicators could provide the necessary trigger for trading decisions.
1-Week, 1-Day, and 4-Hour Time Frame Analysis:
- 1-Week Time Frame: The pair shows a neutral trend, with price oscillating sideways, confirming overall market indecision.
- 1-Day Time Frame: Short-term movements display low volatility with no substantial breakouts, reflecting ongoing consolidation beneath resistance.
- 4-Hour Time Frame: Minor fluctuations are evident but indicate stabilization near the Keltner Channel midline, suggesting potential for a breakout in either direction.
Based on this analysis, it is possible to identify potential entry points:
- Buy Entry Point: 142.500, Take Profit Point: 143.000, Stop Loss Point: 142.250
- Sell Entry Point: 142.200, Take Profit Point: 141.800, Stop Loss Point: 142.375
In conclusion, while both buy and sell scenarios are feasible, the market’s current state of indecision leans slightly towards a Buy scenario given the potential for upward movement as indicated by recent patterns.


