
Forex Technical Analysis Update for April 17, 2025 – 17/04/2025
Tháng 4 16, 2025
Impending Rallies on Gold Against the US Dollar: A Forex Market Analysis – 17/04/2025
Tháng 4 16, 2025Market Overview:
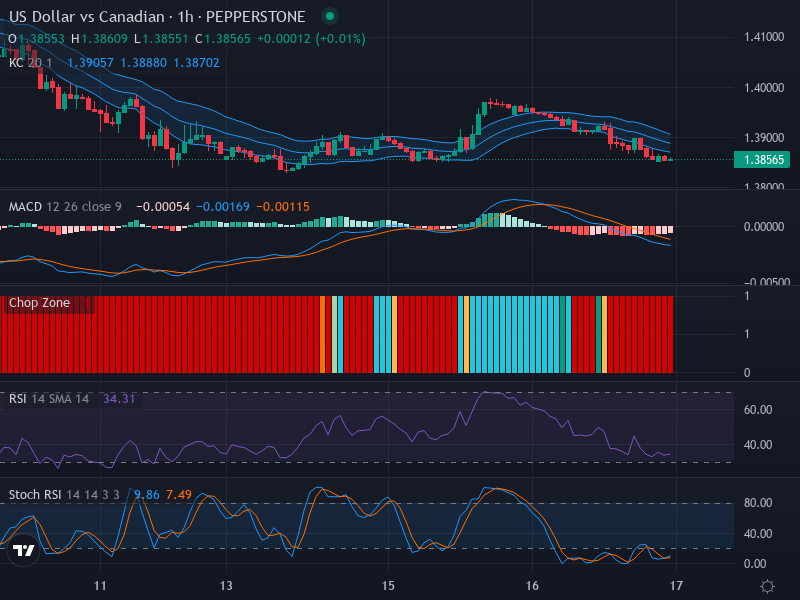
After a thorough examination of the forex landscape, it’s clear that the USD/CAD pair has been on a generally downward trajectory. Currently, the FX pair is trading at around 1.38565. Despite significant fluctuations, the market seems to favour a steady bearish outlook, underpinned by a lack of major bullish formations – an indication of indecisiveness among traders.
Technical Analysis:
Contributing to the bearish narrative for the USD/CAD pair is the dominant downward trend illuminated by a series of lower highs and lower lows in the candlestick patterns. However, there’s a notable absence of any significant bullish engulfing formations near the current price. The series of small-bodied candles further points towards a possibility for continued trader hesitation.
Turning to the price zones, noticeable price surges around the 1.38800 level mark previous minor upswings in the market. Current levels seem poised for retracements with the absence of strong bullish signals hinting at a continuation of the downturn.
Shifting focus to the Relative Strength Index (RSI), the indicator suggests the pair is edging towards an oversold status with a value standing at 34.31. This analysis aligns with the downward trend insinuated by the candlestick movements, but it also points towards weak bullish potential.
In pursuance of verifying the directional bias of the market, the Stochastic RSI divulges a slightly bullish narrative with its K and D line values at 7.49 and 7.86, respectively. Although there’s a slight upward trend hinted at, market participants should tread carefully considering it’s counter to the pair’s primary downward trend.
Further complements to the mixed market indicator interpretations come in the form of the Moving Average Convergence Divergence (MACD) analysis. With a MACD line value of -0.00169, persisting beneath the signal line indicates a bearish bias.
Conclusion and Trading Recommendations:
Given the current configuration of indicators and the sustained bearish bias, traders are advised to maintain a cautious stance. Downward movements may persist as the dominant trend, but the possible reversal hinted at by Stochastic RSI calls for vigilance. Entering long trades at this point should be carefully calculated, considering the lack of assertive bullish signals.
Trend Analysis:
- 1-week timeframe: The general trend is bearish with no clear signs of reversal.
- 1-day timeframe: Suggests a continuation of the bearish sentiment with sporadic minor spikes.
- 4-hour timeframe: Displays a consolidation phase within the bearish trend indicating hesitation from traders.
Potential Entry Points:
For traders looking to capitalize on the analysis:
- Buy Entry Point: 1.38650, Take Profit Point: 1.39000, Stop Loss Point: 1.38400.
- Sell Entry Point: 1.38500, Take Profit Point: 1.38050, Stop Loss Point: 1.38750.
Based on the overall analysis, a Sell scenario appears more likely given the prevailing bearish indicators, particularly with the absence of strong bullish signals.


