Gold vs US Dollar: A Comprehensive Technical Analysis Amid Potential Bullish Continuation – 27/03/2025
Tháng 3 27, 2025
USD/CHF: Bearish Pressure Meets Market Indecision – 28/03/2025
Tháng 3 27, 2025Market Overview
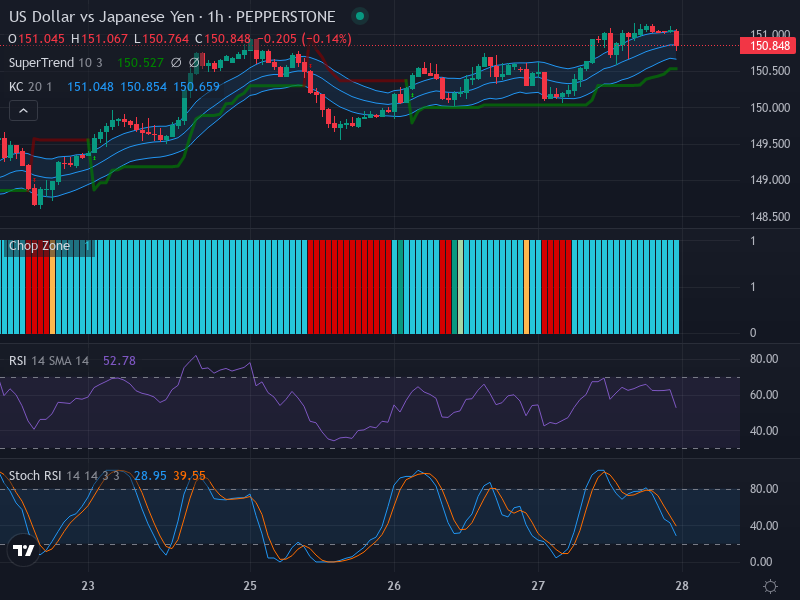
The forex market presents an intriguing view as the USD/JPY currency pair exhibits slight bullish inclination amidst intermittent sideways movements. The current market dynamics highlight that the U.S. Dollar and Japanese Yen are engaged in a tug-of-war, making the currency pair’s movement rather stimulating for market participants and traders alike.
Technical Analysis
In the absence of a distinct candlestick pattern on the chart, the technical parameters primarily drive the ongoing analysis. The existing market direction depicts a minor upward momentum, punctuated by intermittent sideways movement, suggesting an ongoing struggle between bulls and bears.
Anticipating possible zones of movement, if the bullish sentiment sustains its pressure, the USD/JPY pair might surge past the resistance level at 151.00. On the contrary, a shift to bearish persuasion could trigger a retracement towards the support level set at 150.00.
Delving into the Relative Strength Index (RSI), a neutral stance is adopted with a value of 52.78. The index positions itself in equilibrium, affirming an even balance between buying and selling pressures. Furthermore, the RSI subtly endorses the ongoing uptrend without alluding to an immediate possibility of entering overbought or oversold territories. It’s worth noting that no significant divergence is observed, corroborating the congruity between RSI and price movements.
Further elements of technical intrigue involve Keltner Channels and Chop Zone indicators. The price persistently hovers around the middle band of the Keltner Channel, indicative of a slight bullish inclination. Expanded channels hint at moderate volatility, while the uninterrupted blue bars in the Chop Zone reveal an accumulation zone and a sideways-moving market. A conjoint examination infers a potential breakout if the price consecutively closes above the Keltner Channel, turning the Chop Zone neutral.
Lastly, the Stochastic RSI balances at moderately low values, with %K and %D at 28.95 and 39.55, respectively. These readings emphasize caution but could herald a potential trend shift.
Conclusion and Trading Recommendations
This comprehensive technical analysis presents a mild bullish inclination in the USD/JPY pair. Traders could benefit from maintaining a neutral perspective while cautiously monitoring for a breakthrough past the resistance level or retraction towards the support level. However, with the choppy market and potential volatility in near sight, it is recommended to make well-calculated trading decisions.
Market Analysis for Different Time Frames
- 1-Week Time Frame: The pair shows a bullish trend with strong support levels, indicating potential for further gains.
- 1-Day Time Frame: A sideways movement persists, reflecting indecision among traders, with recent peaks around 151.00.
- 4-Hour Time Frame: A slight bullish inclination is observed, suggesting short-term buying opportunities before hitting resistance.
Based on the analysis:
- Buy Entry Point: 150.50 with a Take Profit Point of 151.00 and a Stop Loss Point at 150.30.
- Sell Entry Point: 150.90 with a Take Profit Point of 150.50 and a Stop Loss Point at 151.10.
Upon evaluating the indicators, the analysis indicates a Buy scenario is more likely to prevail due to the overall bullish inclination and ongoing upward momentum.