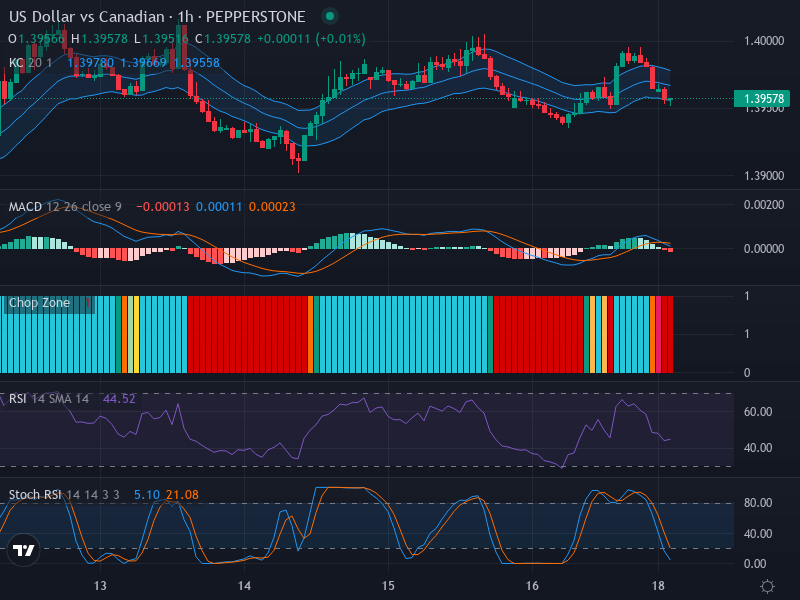
A Detailed Look at the Current Status and Potential Moves of the USD/CAD Forex Pair – 19/05/2025
Tháng 5 18, 2025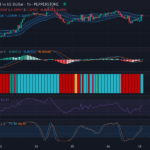
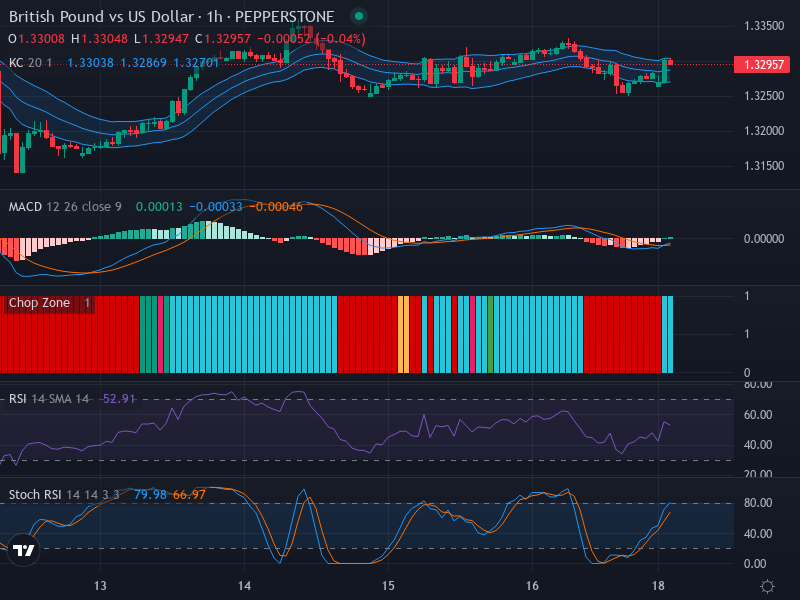
British Pound vs US Dollar Technical Analysis: Mixed Signals Amid Sideways Market – 19/05/2025
Tháng 5 18, 2025Market Overview
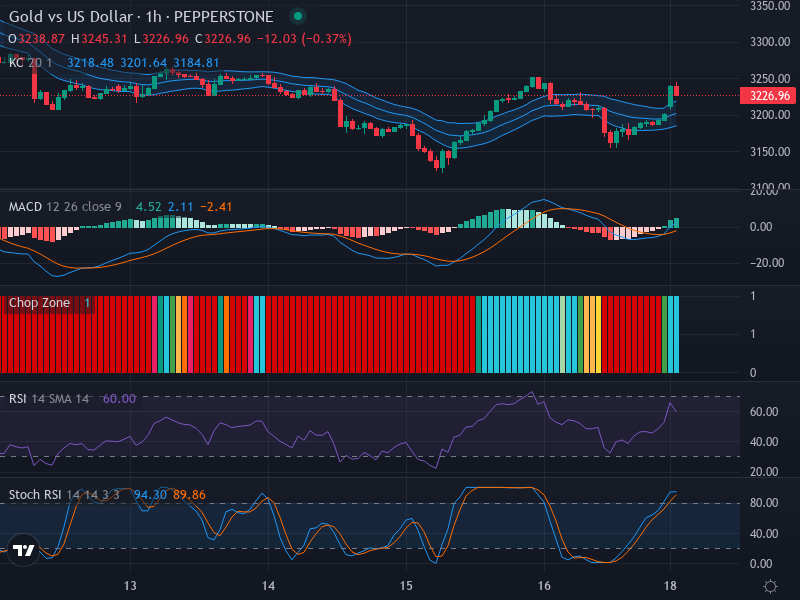
In the foreign exchange landscape, the Gold versus the US Dollar pair has recently indicated strong bullish momentum. Breakouts have been observed in the upward direction, with the current price pegged at 3226.96.
Technical Analysis
Analyzing the pattern via candlestick pattern interpretation reveals a bullish candle that has breached above the Keltner Channels. This breach is typically a reliable sign, implying a robust upward thrust. Given this breakout, we can speculate the possibility of the upward movement continuing unless a reversal pattern appears on the chart.
Despite the bullish outlook presented in the candlestick patterns, the Relative Strength Index (RSI) sits at a neutral 60, neither in the overbought nor oversold realm. This RSI reading supports the ongoing trend. However, its proximity to the neutral zone may suggest a potential deceleration in market momentum.
On the other hand, the Stochastic RSI (Stoch RSI) indicates a contrasting perspective. The K and D lines are positioned at 94.30 and 89.86 respectively, signifying an overbought scenario. This hints at the potential for a pullback or a corrective phase ahead, hence opposing the current upward trend.
The Moving Average Convergence Divergence (MACD) complements the trend suggested by the candlestick pattern and RSI indicators. The MACD (4.52) is hovering above the signal line (2.11), pointing towards bullish momentum. The rising histogram bars lend additional weight to the bullish sentiment. This strategic MACD alignment strengthens the likelihood of continued upward movement.
When combining the insights from these various indicators, a bullish trend, as affirmed by the Keltner Channels, the candlestick pattern, and the MACD emerges. However, both the neutral RSI and overbought Stoch RSI readings could foreshadow a forthcoming slow down or corrective phase.
Conclusion and Trading Recommendations
As it stands, the combined indicators in the technical analysis support a bullish short-term outlook for the Gold versus US Dollar pair. Traders are recommended to capitalize on this upward momentum by adopting a buy strategy until further signs of a trend reversal or a clear consolidative phase. However, the conflict between Stoch RSI and other indicators might suggest a potential pullback, therefore caution is recommended.
Trend Analysis:
- 1-Week Time Frame: The market shows consistent bullish trends with a series of higher highs and higher lows, indicating strong bullish sentiment.
- 1-Day Time Frame: A recent bullish breakout suggests an ongoing upward movement while maintaining higher closing prices.
- 4-Hour Time Frame: Indications of increased volatility with minor pullbacks but generally reflective of an upward trend.
Potential Entry Points:
- Buy Entry Point: 3230.00, Take Profit Point: 3250.00, Stop Loss Point: 3210.00
- Sell Entry Point: 3215.00, Take Profit Point: 3195.00, Stop Loss Point: 3235.00
Considering the analysis above, a Buy scenario appears more likely in the short term due to prevailing bullish signals, despite some warnings from the Stoch RSI indicating a possible short-term correction.