Forecasting Gold-US Dollar (XAU/USD) Pair with Prominent Technical Indicators – 25/03/2025
Tháng 3 24, 2025
Neutral Market Conditions Overshadowing GBP/USD – A Consolidative Phase in Sight – 26/03/2025
Tháng 3 26, 2025Market Overview
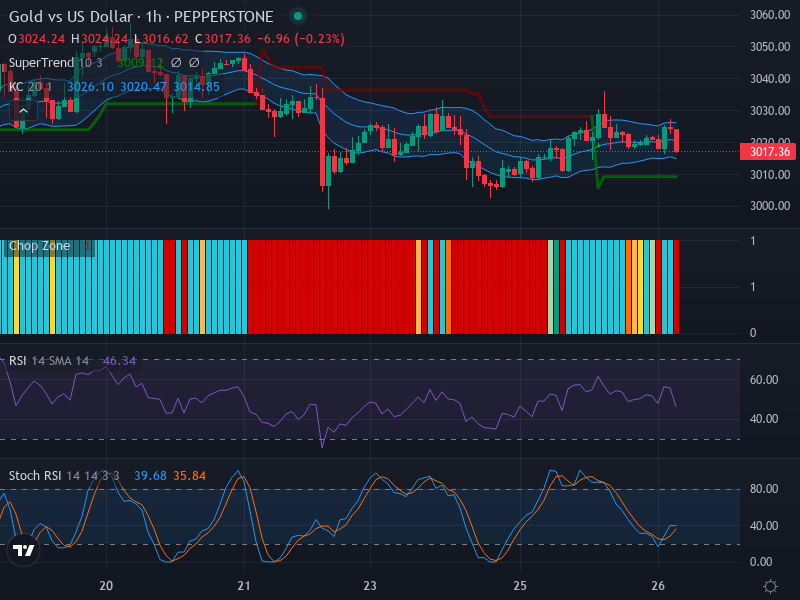
The price behavior of Gold vs US Dollar on the one-hour chart from Pepperstone reveals a market caught in a consolidation phase. This situation results in an environment characterized by ambivalence, as the currency pair swings within a specific range while displaying low momentum. The market currently struggles to produce any significant directional movement, leaving traders guessing.
Technical Analysis
Chart Patterns and Price Action
The analysis of the current chart prominently displays a lateral direction, indicated by the formation of small-bodied candlesticks. These candlesticks symbolize indecision within the market, as there are no notable bullish or bearish patterns such as engulfing or doji formations. Traders appear to be in a holding pattern, awaiting a definitive break either above the 3024 mark—which could trigger a potential price surge—or below the 3015 level, suggesting an opportunity for downward retracement.
Technical Indicators Evaluation
A look at the Relative Strength Index (RSI) reveals a current level of 46.34, which denotes a balanced state. This indicates that the market is neither overvalued nor undervalued, as the RSI hovers around the neutral 50 level. This oscillation fortifies the perception of ongoing sideways price action.
The development of price within the Keltner Channels further illustrates this trend. With the price action residing around the middle band, it highlights a long-term sideways movement coupled with a recognizable low degree of volatility. This environment of minimal upward or downward momentum is confirmed by the thick red bars noted in the Chop Zone.
The analysis of the Stochastic RSI (Stoch RSI) aligns well with the prevailing sentiments. The K and D lines are currently recorded at 39.68 and 35.84 respectively, both lying beneath the mid-level. This indicates that trading momentum remains minimal, further supporting the overarching picture of a market locked in a stalemate.
Conclusion and Trading Recommendations
In conclusion, the technical examination of the market illustrates a phase of hibernation within this consolidation stage. The ambiguity gleaned from chart patterns and the absence of decisive momentum across various technical indicators suggest a strategic ‘hold’ position is prudent. Traders should remain vigilant, keeping an eye out for a break above 3024 which could signal buying opportunities, or a drop below 3015 indicating potential selling signals.
Risk Disclaimer
It is vital to note that financial markets carry inherent risks, and trading decisions should be made carefully while considering individual risk appetites, financial situations, and trading goals. This analysis serves as a general overview of market conditions and is intended for informational purposes only. It is not a substitute for professional financial guidance.