Steve Cohen’s Market Insights: Risks, Opportunities, and Strategic Investments
Tháng 5 14, 2025
GBP/USD Faces Downward Pressure Amid a Potential Retracement – A Comprehensive Technical Forecast – 15/05/2025
Tháng 5 14, 2025Market Overview
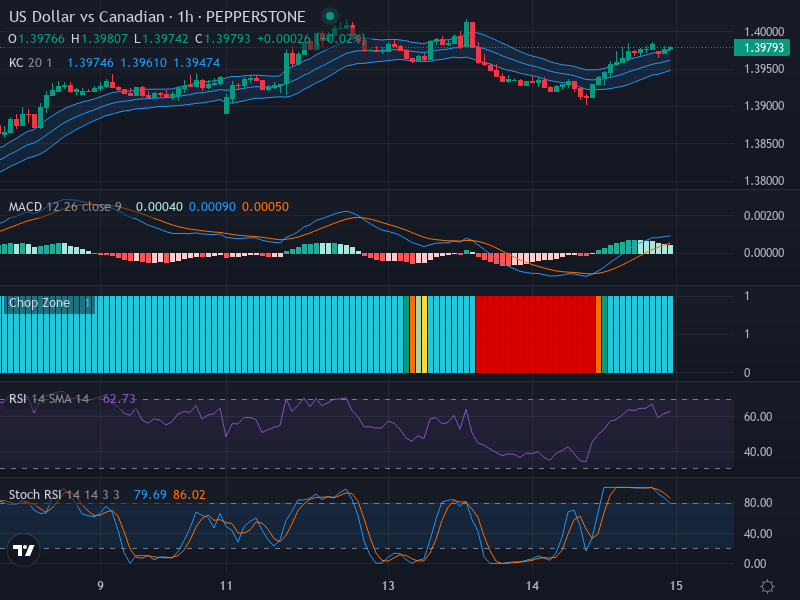
Casting our gaze onto the Forex market, we narrow our focus to the US Dollar versus Canadian Dollar (USD/CAD) trade setup. The pair’s current exchange rate stands at 1.39793, and recent market developments reflect a level of uncertainty, with potential room for significant moves in the short-term.
Technical Analysis
Pivoting to the candlestick chart for the USD/CAD pair, we note that recent patterns portray a clear tension between bulls and bears. Small-bodied candlesticks are popping up, hinting at the probability of a lateral market direction in the short term. Adding to the market suspense, prices have hitched a ride to the 1.39800 resistance level, shimmering with the promise of a potential retracement should resistance hold firm.
When we head south onto the technical territory of the Relative Strength Index (RSI), we find our indicator nudged towards the overbought region with a value hinting at 62.73. The RSI does not betray any major divergences that could unravel the ongoing consolidation patterns woven by the price action.
Scaling the Keltner Channels, the observed price action seems to be playing tag with the middle band, highlighting a state of moderate volatility in the market. This activity is further backed by our trip into the Chop Zone, affirming a sideways market read with bars growing increasingly thicker, suggesting potentially greater future volatility for those with sharp eyes.
Diving into the depths of the Stochastic RSI, we find both the K and D lines lounging in the overbought area with readings of 79.69 and 86.02 respectively. Although there are no immediate crossovers, traders should pay heed to the existing overbought conditions that could act as a dampener to any further ascent.
The MACD in its voyage tells us a tale that is yet untold, standing on the brink of a revealing climax.
Conclusion and Trading Recommendations
With all technical factors in consideration, the uncertainty in the market is disseminated by the indecisive candlestick patterns and supported by the overbought readings in the RSI and Stochastic RSI. If the market continues in a sideways trajectory, traders should keep a close eye on the resistance level of 1.39800 for potential impacts.
As with the changing winds and tides, Forex trading is ruled by probabilities rather than certainties. Given the overbought status, a reversal or pullback is likely. Regardless, waiting for a clearer signal, such as a price jump above the Keltner upper channel, before executing trades could lead to optimized decision making.
Trend Analysis:
- 1-week Time Frame: The prevailing trend shows a modest consolidation below the resistance level, signaling possible indecisiveness in the market.
- 1-day Time Frame: The market displays a steady range with no strong indications of either bulls or bears asserting control.
- 4-hour Time Frame: Recent movements suggest a potential shift towards a bearish pullback, though signs of volatility are also presenting themselves.
Based on this thorough analysis, potential entry points at the 1-hour time frame include:
- Buy Entry Point: 1.40000, Take Profit Point: 1.40500, Stop Loss Point: 1.39600.
- Sell Entry Point: 1.39700, Take Profit Point: 1.39200, Stop Loss Point: 1.39950.
Considering the analysis of trends in each time frame and the significant overbought conditions, a Sell scenario appears more likely to unfold in the near term. Traders should remain vigilant to the resistance level while preparing to adapt quickly to market changes.