## Market Overview
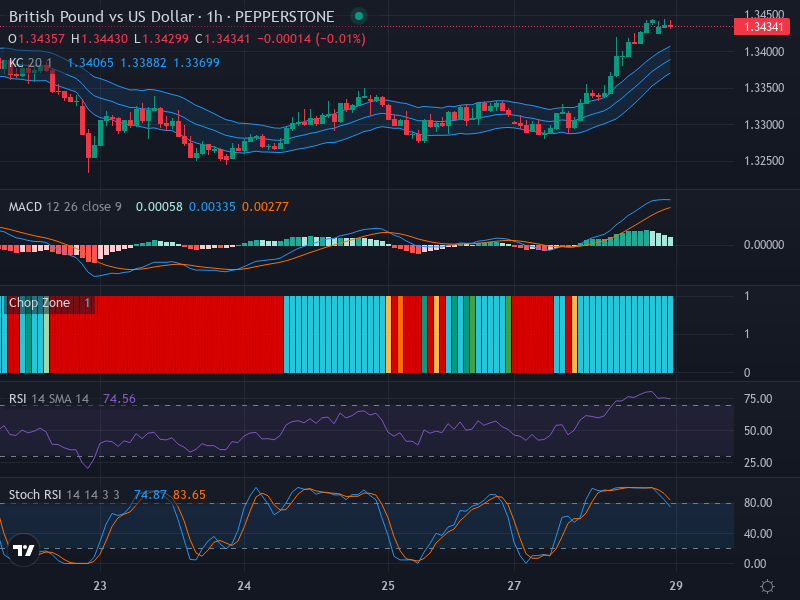
At a current rate of **1.34341**, the [GBP/USD currency pair](https://eatrading.ai/a-neutral-tide-in-the-gbp-usd-current-key-technical-notes-and-strategies-28-03-2025/) sketches an interesting picture for forex traders who are seeking opportunities in the marketplace. Currently, the draw is predominantly in favor of the **[bullish](https://eatrading.ai/a-neutral-tide-in-the-gbp-usd-current-key-technical-notes-and-strategies-28-03-2025/) camp** with a strong uptrend spotted in recent sessions, as clearly indicated by a succession of **bullish candles**. However, traders should keep an eye on potential zones for price retracement that might arise near the **1.34500 level**, where visible resistance is identified.
## Technical Analysis
Regarding chart patterns and indicators, it appears that the market might be preparing for a possible change in tune. The **Relative Strength Index (RSI)**, which stands at **74.56**, is in the overbought territory, suggestive of a looming price correction. However, this is only a whisper since no clear RSI divergence aligns with the price movement thus far.
In contrast, the **Stochastic RSI** brings to the table a slightly different perspective as the K line (74.87) dips beneath the D line (83.65), hinting at a potential **bearish divergence**. As such, this indicator might forewarn of a temporary bearish manipulation, possibly setting the stage for a short-term pullback.
Unraveling the **MACD Index**, we see clear signs of a **bullish crossover** with the MACD line (0.00058) soaring above the signal line (0.00335), thus marking a robust bullish consequence. However, the histogram, unfortunately, thins out, suggesting waning bullish vigor. This trend in the histogram could be an early alarm bell for an impending **trend reversal** or correction in the not-too-distant future.
## Conclusion and Trading Recommendations
Reviewing the entire technical synopsis, the GBP/USD pair is currently navigated by bullish winds. However, overbought conditions alongside weakening bullish momentum reveal a possibility for some upcoming price consolidation or correction.
Considering these elements, traders should remain vigilant before going long on their positions. A prudent approach might involve waiting for a potential pullback and monitoring for any further signs of [bearish reversal](https://eatrading.ai/a-neutral-tide-in-the-gbp-usd-current-key-technical-notes-and-strategies-28-03-2025/) on the minor timeframe charts. If prices seem to stabilize around the [resistance level](https://eatrading.ai/a-neutral-tide-in-the-gbp-usd-current-key-technical-notes-and-strategies-28-03-2025/) of **1.34500**, that might signal a right entry point for long positions following the correction.
### Trading Analysis for Time Frames
- On the **1-week time frame**, the trend shows a clear bullish movement with solid support levels reinforcing upward momentum.
- The **1-day time frame** indicates possible overbought conditions, hinting at a needed correction in the short term.
- In the **4-hour time frame**, we observe signs of weakening bullish momentum, providing groundwork for a potential retracement.
Based on this multi-timeframe analysis, possible entry points based on expected price movements include:
- **Buy Entry Point**: 1.34000, **Take Profit Point**: 1.35000, **Stop Loss Point**: 1.33500.
- **Sell Entry Point**: 1.34500, **Take Profit Point**: 1.34000, **Stop Loss Point**: 1.34800.
Given the analysis, the current scenario leans towards a **Buy scenario** as the market may continue to show strength, especially if price action demonstrates consolidation near support after a short correction. However, cautious traders may opt to wait for confirmation before entering new positions.