
Bullish Momentum Spikes in the Gold Vs. US Dollar Market: A Detailed Analysis – 01/04/2025
Tháng 4 1, 2025
PVH Corp’s Q4 Earnings Surge: A Bright Future for Investors
Tháng 4 1, 2025Market Overview
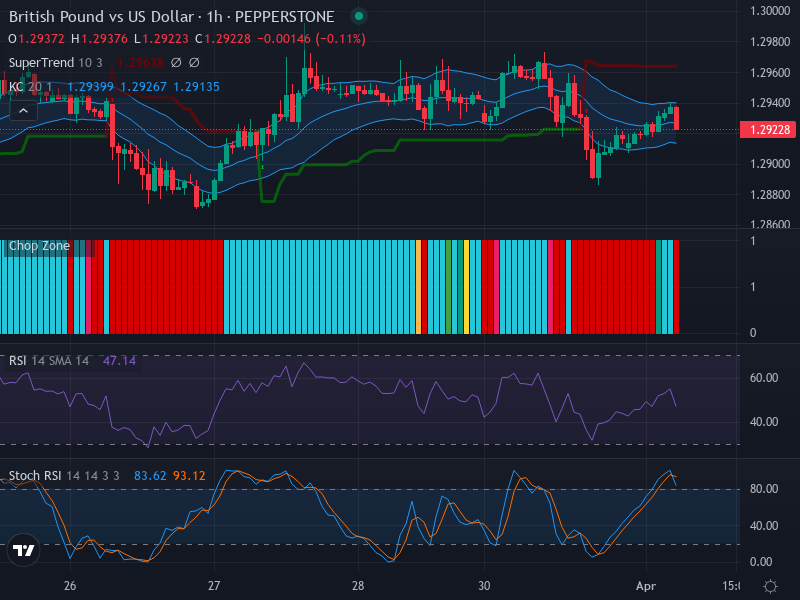
In the pairing of the British pound to the US dollar, the forex market has demonstrated a conspicuous lack of definitive direction, exhibiting primarily a lateral, or sideways, trend. This relates to the value of GBP/USD oscillating within a relatively narrow range, tethered between key support and resistance price zones of 1.2900 and 1.2960, respectively. The currency pair’s dance between these numerals is characterized predominantly by small-bodied candlesticks, an indication of market uncertainty.
Technical Analysis
Examining the crux of the technical indicators, it becomes clear that the market positioning maintains a neutral bias, barely leaning towards selling pressure, as indicated by the RSI value of 47.14. The lack of clear divergence remains supportive of a sideways trend, yet the hint towards sell inclination provides a subtle market sentiment hint.
The Keltner Channels analysis, while known for aiding in determining the directionality of market trends, shares the same story of ambiguity. The price mainly dithers around the EMA 20, lacking the conviction to establish a robust trend. Furthermore, despite this landscape of uncertainty, the levels of volatility remain steady, without significant expansion, and the ongoing hue-switching bars on the accumulation zone suggest persistence of the sideways orientation.
Notably, the Stochastic RSI (Stoch RSI) presents an intriguing twist, as the Stoch RSI K (currently at 83.62) and D (sitting at 93.12) have both crossed over the 80 threshold, suggesting overbought conditions and hence potential downward pressure. While this revelation contrasts with the predominant lateral movement, it certainly introduces a smidgen of a contrarian viewpoint.
Conclusion and Trading Recommendations
The overall assessment for the GBP/USD pair in the upcoming week continues to revolve around the sideways trend with a potential touch of resistance anticipated. The 1-day trend is neutral with an ever-so-slight upward inclination, and the 4-hour view remains confined within the Keltner Channels’ boundaries, lacking a clearly defined direction.
Given these conditions, it might be advisable for traders to stay vigilant for increased volatility and be prepared to operate strategically within the established boundaries of the price zones. Nevertheless, the Stochastic RSI signaling towards overbought pointers provides a gentle suggestion to entertain the possibility of entering short positions.
Short-Term Analysis
In our more granular analysis of the 1-week, 1-day, and 4-hour time frames, we observe several trends:
- The 1-week analysis indicates a sideways trend with both support and resistance levels firmly in place, suggesting little movement outside these bounds.
- The 1-day trend emerges as slightly bullish, hinting at potential upward action but lacking momentum for a decisive breakout.
- The 4-hour view reflects a lack of significant directional movement, consistently flitting between minor highs and lows within the trading range.
As a result of this analysis, potential entry points at the 1-hour time frame are identified based on the consideration of the indicators and market conditions. The anticipated entry and exit points for trading are as follows:
- Buy Entry Point: 1.2915, Take Profit Point: 1.2945, Stop Loss Point: 1.2900
- Sell Entry Point: 1.2950, Take Profit Point: 1.2920, Stop Loss Point: 1.2965
In conclusion, the likelihood of a Sell scenario appears more pronounced, especially given the impending overbought conditions indicated by the Stochastic RSI and broader market sentiments suggesting a pullback in response to resistance.


