

Pete Hegseth’s Bold Move Towards Equal Standards in U.S. Military Combat Roles
Tháng 4 2, 2025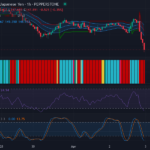
Grounded Bearish Outlook: USD/JPY Faces Stiff Downward Pressure – 03/04/2025
Tháng 4 2, 2025Market Overview
Currently, the USD/CHF pairing finds itself in a strong bearish, or downward, trend. Despite this, the current market conditions suggest a potential retracement or short-term upward correction, a phenomenon that could occur around the 0.8800 mark. This insight is based on historical support and momentum indicator values hinting at the market being oversold.
Technical Analysis
The candlestick pattern depicted on the chart signals a considerable downward momentum. This bearish formation often points to an impending continuation of the current trend and could lead to further depreciation of the US dollar against the Swiss franc.
The examination of the Relative Strength Index (RSI), with a current value of 23.67, reveals the market status as being oversold. Such a low reading typically suggests a potential for a price bounce or consolidation phase in the near future, which could temporarily oppose the primary downward trend.
Beyond the RSI, the Keltner Channels and the Chop Zone provide additional confirmation of the bearish market. The Forex pair’s price sits below the middle band of the Keltner Channels, an indicator supporting the continuation of the downtrend, yet also hinting at expanding market volatility. Furthermore, the Chop Zone is drenched in red, which corresponds to the strong downward trending market, without any visible signs of a breakout potential.
The Stochastic RSI paints a similar picture, with its K and D lines hovering at very low levels, signifying an oversold market condition. With this, a potential bullish crossover could spark a short-term upward correction.
Conclusion and Trading Recommendations
Putting the analysis into different time frame perspectives shows a unanimous bearish trend. On a weekly scale, though the overall trend is bearish, the overselling condition reflected by RSI indicates that a price bounce could occur. On the daily and 4-hour charts, the theme of a strong downward trend persists, but the oversold indicators suggest a potential pullback.
Given these observations, traders are advised to monitor the developing patterns closely, as there are potential opportunities for both selling in the bearish trend and buying in the anticipated short-term correction.
Analysis of Time Frames
- 1-Week Trend: Strong overall bearish trend with signs of oversold conditions, indicating a potential bounce.
- 1-Day Trend: Continues to show a pronounced downtrend, though oversold indicators suggest a short-term opportunity to buy.
- 4-Hour Trend: Reflects strong bearish momentum but aligns with oversold signals, hinting at a possible upward correction.
Potential Entry Points
Based on the above analysis of the indicators and tools, potential entry points are as follows:
- Buy Entry Point: At 0.8820, targeting a Take Profit at 0.8880, with a Stop Loss set at 0.8780.
- Sell Entry Point: At 0.8765, aiming for a Take Profit at 0.8700, with a Stop Loss set at 0.8790.
In summary, while the analysis indicates a predominant bearish market, the oversold conditions suggest a more favorable scenario for a Buy situation in the short-term, as traders might capitalize on a short-term bounce. Investors should remain cautious, however, as the prevailing downward trend may still present profitable opportunities to sell.


