
USD/JPY Marches Sideways: Intermittent Bullish Signals Require Scrutiny – 01/05/2025
Tháng 4 30, 2025South Korea’s Export Surge: Resilience Amid U.S. Tariff Challenges
Tháng 5 1, 2025Market Overview
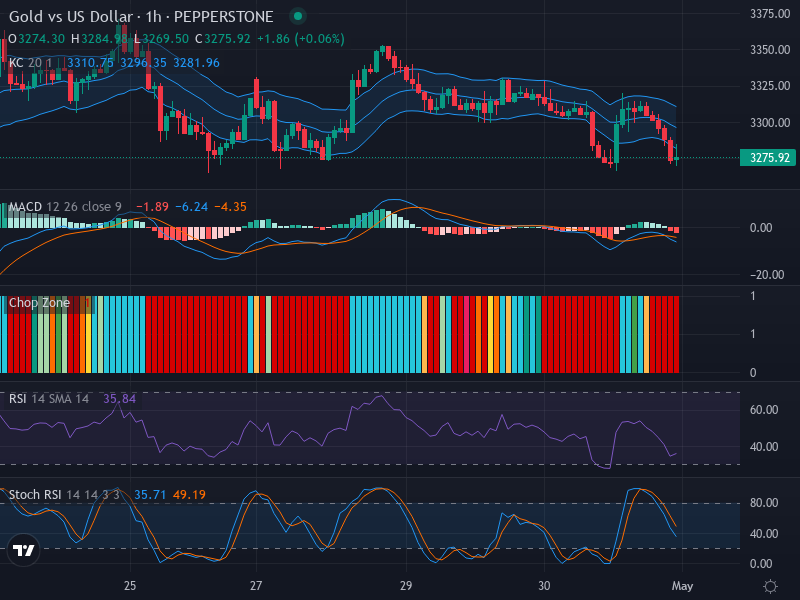
The rivalry in the forex arena between gold and the US dollar has recently shifted in favor of the dollar, as the value of gold experiences a notable decline. Currently, gold is trading at $3,275.92, reflecting a bearish trend driven by recent economic developments and overall market sentiment. However, a potential bullish opportunity is emerging at the $3,280 level, suggesting that there may still be room for a rebound under certain market conditions.
Technical Analysis
The bearish momentum for the gold vs US dollar pair is vividly represented in the technical charts, where a series of descending candles indicates a pervasive bearish influence. This collective movement suggests a possible price decline, which could lead gold toward a retracement zone around $3,280.
The Relative Strength Index (RSI) is currently positioned at 35.84, hovering just above the oversold territory. This positioning indicates that gold has faced significant selling pressure in the market, implying a potential for a price bounce or a brief bullish correction soon. Despite this, it is important to note that there hasn’t been a significant divergence from the prevailing downward trend.
Further enforcing the bearish perspective, the Stochastic RSI demonstrates ongoing downward momentum, with the K line at 35.71 lying beneath the D line at 49.19. This pattern supports the idea of continued bearish behavior in the gold market.
The Moving Average Convergence Divergence (MACD) is also painting a bearish picture, showcasing a crossover where the MACD line at -1.89 sits below the signal line at -6.24. This reinforces the current downward trend with no signs of impending reversal.
In alignment with these indicators, the price remains below the middle Exponential Moving Average (EMA), firmly rooting gold in bearish territory according to the Keltner Channels. The moderate expansion of these channels suggests the presence of volatility, while the Chop Zone, filled mostly with red bars, emphasizes the dominance of bearish pressure in the market.
Conclusion and Trading Recommendations
The analysis indicates a strong likelihood that the prevailing bearish trend for gold against the US dollar will continue in the near future. Based on the thorough examination of technical indicators, oscillators, and chart patterns, traders are encouraged to consider short-selling positions primarily. However, they should remain alert to the potential bullish opportunity at the $3,280 mark, should there be a surge in bullish momentum.
Time Frame Analysis
In reviewing various time frames:
The 1-week trend confirms a strong bearish continuation.
The 1-day pattern indicates possible brief corrections but concludes with a bearish sentiment prevailing.
The 4-hour outlook presents consistent downward momentum, suggesting that further declines are likely to occur.
Potential Entry Points
For traders looking to enter the market, specific recommendations based on the above analysis are as follows:
Buy entry point could be identified at $3,280, with a Take Profit point around $3,300 and a Stop Loss point at approximately $3,270.
Conversely, a Sell entry point can be marked at $3,275, aiming for a Take Profit point near $3,250 with a Stop Loss point set at around $3,285.
Based on this analysis, a Sell scenario appears more likely as the prevailing bearish trend continues to establish its dominance in the gold vs US dollar pair.


