Arizona’s Medicaid Fraud Crackdown: Exposing Sober Living Home Scams
Tháng 5 22, 2025
EUR/USD: A Comprehensive Technical Analysis Amid Bearish Momentum – 23/05/2025
Tháng 5 22, 2025Today, the Forex market reflects a dynamic landscape influenced by various economic factors, technical indicators, and trader sentiments. This blog delves into the current state of technical analysis, focusing on key trends, patterns, and potential entry points for traders looking to make informed decisions.
Current Market Trends
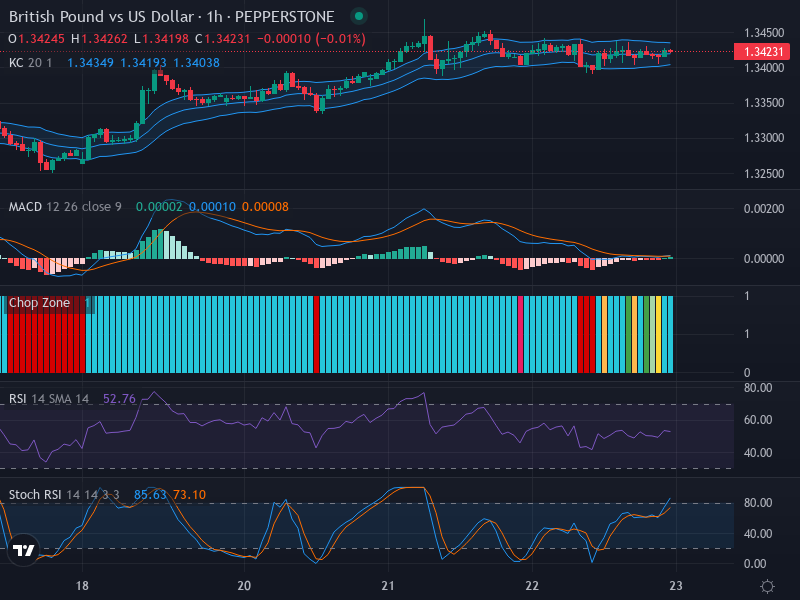
As of May 23, 2025, the Forex market demonstrates a bullish trend for several currency pairs, particularly the EUR/USD and GBP/USD. Recent data indicates that the upward momentum is supported by positive economic indicators, including stronger-than-expected employment figures and consumer sentiment reports in the Eurozone and the UK.
Price Patterns and Key Levels
Trend analysis shows that both pairs are approaching significant resistance levels. The EUR/USD is nearing a psychological barrier at 1.1500, while the GBP/USD tests the 1.3000 mark. The interaction of price with these levels could signal a potential reversal or continuation of the current trend, making it crucial for traders to stay vigilant.
Utilized Indicators
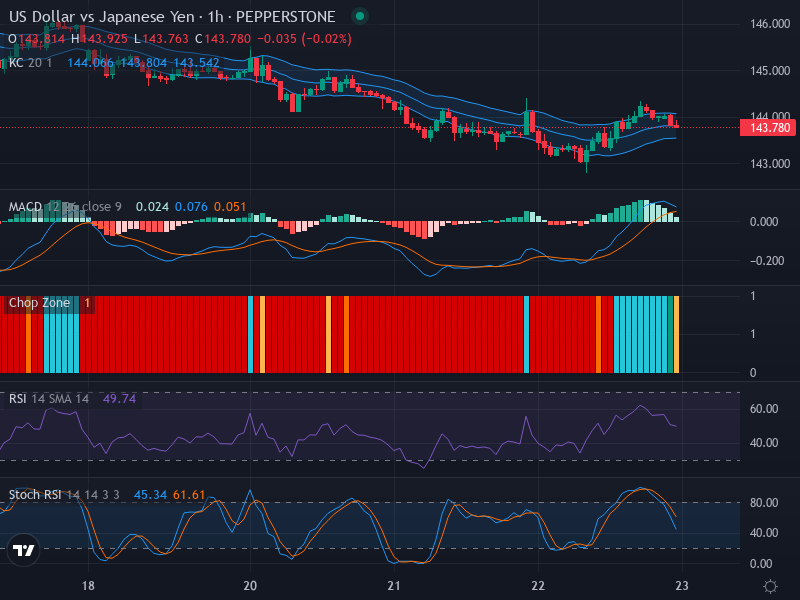
To enhance our analysis, several technical indicators are applied. The Relative Strength Index (RSI) indicates that the currency pairs are nearing overbought territory, which suggests that a pullback could occur if the momentum falters. Furthermore, the Moving Average Convergence Divergence (MACD) displays a bullish crossover, confirming the prevailing sentiment in the market. Additionally, short-term moving averages (like the 20-period MA) remain above the longer-term averages, reinforcing the bullish outlook.
Timely Insights Based on Time Frames
Understanding different time frames can provide valuable insights for traders. Analyzing the market across multiple time frames reveals distinct trends:
- 1-Week Time Frame: The overall trend remains bullish, with higher highs and higher lows indicating sustained upward momentum.
- 1-Day Time Frame: Price action is testing resistance levels, and caution is warranted as the RSI approaches overbought conditions.
- 4-Hour Time Frame: Here, we observe supporting buy signals from shorter moving averages, suggesting a continuation pattern despite nearing resistance.
Based on the analysis, potential entry points on the 1-Hour Time Frame can be identified as follows:
For a Buy Scenario, traders might consider entering at 1.1480 with a Take Profit target at 1.1550, while placing a Stop Loss at 1.1450. This setup accounts for market fluctuations and expected volatility.
Conversely, for a Sell Scenario, traders can look for entry at 1.1520, targeting a Take Profit at 1.1450, with a Stop Loss set at 1.1550. This provides a strategic plan for capturing potential reversals.

In conclusion, while both scenarios present viable opportunities, the bullish trend indicated by multiple indicators suggests that a Buy scenario is more likely to present itself. Leveraging the current market analysis will provide traders with the necessary tools to navigate the complexities of Forex trading effectively.