
AUDUSD Currency Pair Analysis: Bullish Trends and Key Insights for Traders
Tháng 5 6, 2025
Navigating the NZD/USD Currency Pair: Trends, Support, and Market Sentiment
Tháng 5 6, 2025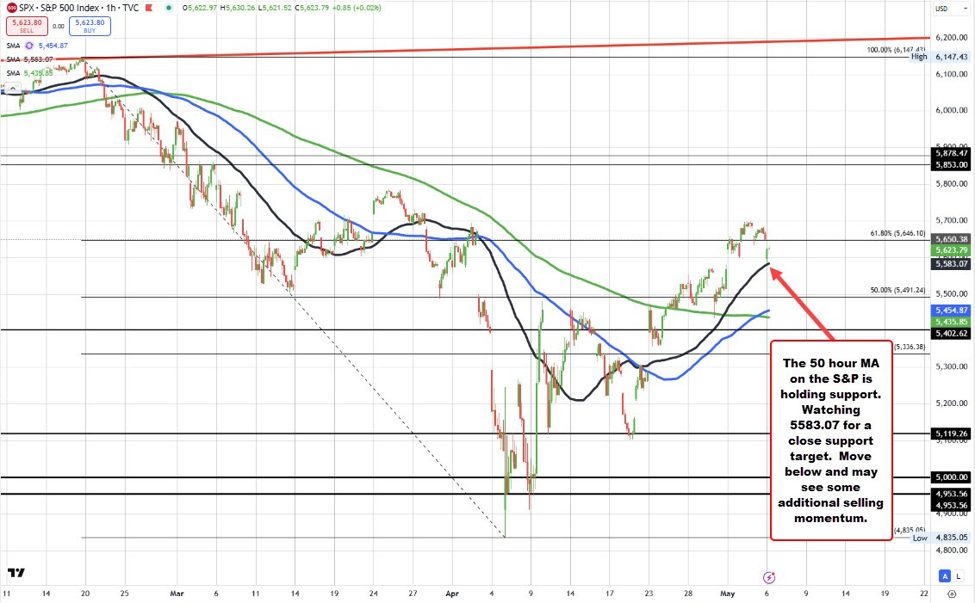
Analyzing Recent Market Activity: S&P 500 and Nasdaq Indices Show Strong Short-Term Performance
Recent market dynamics have garnered significant attention, particularly the impressive recovery of the S&P 500 and Nasdaq indices. As of May 5, 2025, both indices have demonstrated robust movements, bouncing near their 50-hour moving averages (MAs) and indicating a prevailing influence of buyers in the short-term market landscape.
Market Performance Analysis
On this noteworthy trading day, the S&P 500 wrapped up at an impressive 5,686.68, marking a substantial 1.5% increase, while the Nasdaq Composite soared by an equal 1.5%, closing at 17,977.73. Such gains not only reflect positive sentiment among investors but also highlight the indices’ resilience in the face of economic uncertainties. Analysts are now closely monitoring this upward momentum, primarily focusing on pivotal support levels that can help determine the market’s immediate trajectory. For an in-depth look at recent stock performances of notable companies and the importance of monitoring market dynamics, refer to this blog.
Technical Analysis: Key Levels to Watch
A significant focal point for traders is the 5,567 level for the S&P 500. Analysts suggest that maintaining this threshold could signify bullish momentum, which may lead to targets as high as 5,700. The 50-hour moving average is acting as a crucial line of support, and its presence in the current market context implies that buyers might very well strengthen their position.
However, investors should proceed cautiously as the S&P 500 has notably experienced four consecutive days of overbought conditions, a scenario that is relatively rare. This phenomenon could pose a risk, suggesting a potential short-term trap for those overly bullish on the market. The implications of this condition can’t be underestimated, as it may indicate a nearing correction or slow down, thus advising investors to remain vigilant. For guidance on avoiding major investment mistakes during volatile periods, check out this article.
Monitoring Technical Indicators for Future Movements
In conjunction with price movements, technical indicators are gaining traction among market watchers. There’s ongoing discourse regarding the overarching market momentum and risk appetite, with a keen eye on whether these indices can navigate their way past the influential 200-day moving averages. Such developments would signal a broader shift in the market’s health and can lead to increased investor confidence. To keep up with recent stock movements and technical analyses, explore this discussion.
In conclusion, while buyers currently maintain a short-term advantage in the S&P 500 and Nasdaq indices, the market’s long-term outlook remains uncertain. Technical levels will play a crucial role in shaping the future, and the cautious optimism in the wake of historical patterns suggests that both opportunities and risks lie ahead. Investors are encouraged to keep abreast of market signals and make informed decisions as these indices continue to unfold their stories in the trading arena.