GBP/USD Pair Analysis: A Brief Moment of Calm Amidst Turbulence – 29/03/2025
Tháng 3 28, 2025
CFPB Legal Victory: A New Dawn for Consumer Protection in America
Tháng 3 29, 2025Market Overview
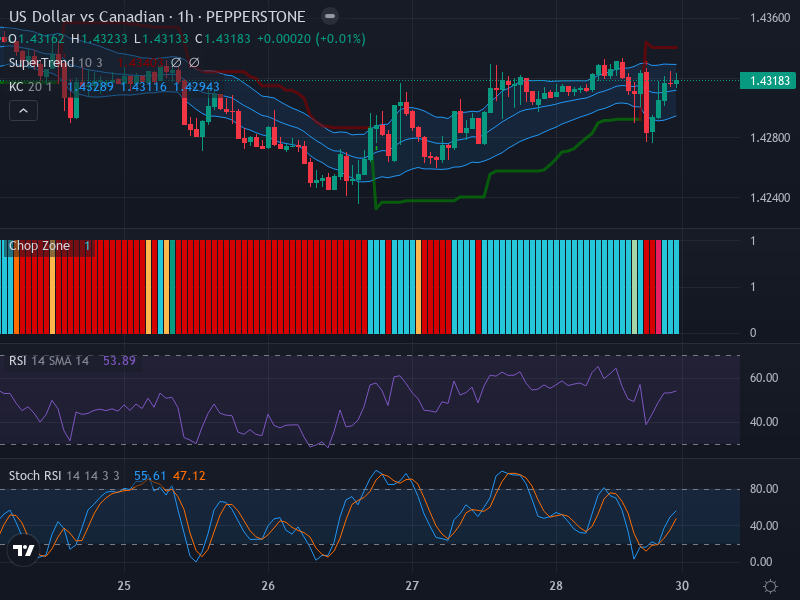
Currently, the foreign exchange market is witnessing the lateral movement between the United States Dollar (USD) and the Canadian Dollar (CAD). Oscillating between resistance and support levels of 1.4340 and 1.4280 respectively, the pair illustrates sagacious indecisiveness. Amid this cautious trading environment, participants are holding their positions tight, waiting for a significant price breakout from the current Keltner Channels.
Technical Analysis
Taking a deeper dive into the pair’s recent candlestick patterns, traders can identify the somewhat hesitant market atmosphere. A series of small-bodied candlesticks coupled with the formation of dojis and spinning tops bespeak of the market’s uncertainty and the ongoing sideways trend. When combined with the placement of the price near the middle band of the Keltner Channel, the scenario underscores the lateral movement of the pair with an added perspective of limited volatility.
With respect to indicators, our analysis begins with the Relative Strength Index (RSI), currently reflecting a balanced view at 53.89. The RSI value does not hint at any extreme oversold or overbought signals, harmonizing with the analysis of the ongoing sideways trend. There isn’t any substantial divergence recorded between the RSI and the price movement, further emphasizing the market’s neutral stance.
However, the Stochastic RSI (Stoch RSI) quietly connote a different tale. The ‘K line’, lingering above the ‘D line’ at 55.61 and 47.12 respectively, molds the environment conducive for a slightly bullish crossover. This could lend the USD/CAD pair an upward push if the upward trend gains momentum.
Conclusion and Trading Recommendations
In conclusion, the USD/CAD is dangling in limbo, stuck within limited trading boundaries and showing no significant signs of breaking out. The market is primarily guided by cautious indecisiveness among market participants. However, the bullish crossover suggested by the Stoch RSI implies the potential for a short-term buying opportunity if an upward trend is reinforced. Traders are advised to closely monitor the pair for any breakout signs.
Time Frame Analysis
Analyzing the USD/CAD across different time frames reveals distinct trends:
- In the 1-week time frame, the pair shows a stable range, indicating continuation of the sideways movement without clear bullish or bearish momentum.
- The 1-day time frame suggests potential volatility but still exhibits a cautious stance with the current movements hovering near the upper and lower bounds of the established range.
- The 4-hour time frame has recently shown signs of potential upward momentum but remains constrained within the significant resistance and support levels.
Trading Strategy
Based on this technical analysis, here are specific entry points:
Buy entry point: 1.4305, Take profit point: 1.4330, Stop loss point: 1.4280.
Sell entry point: 1.4275, Take profit point: 1.4240, Stop loss point: 1.4300.
Given the current indicators and findings, a buy scenario is more likely to occur, contingent on observing a breakout above the resistance level.