
Foreseeing Potential Trends in GBP/USD: A Comprehensive Forex Technical Analysis – 05/05/2025
Tháng 5 4, 2025Asian Market Resilience: Growth Amid Holiday Closures
Tháng 5 5, 2025Market Overview
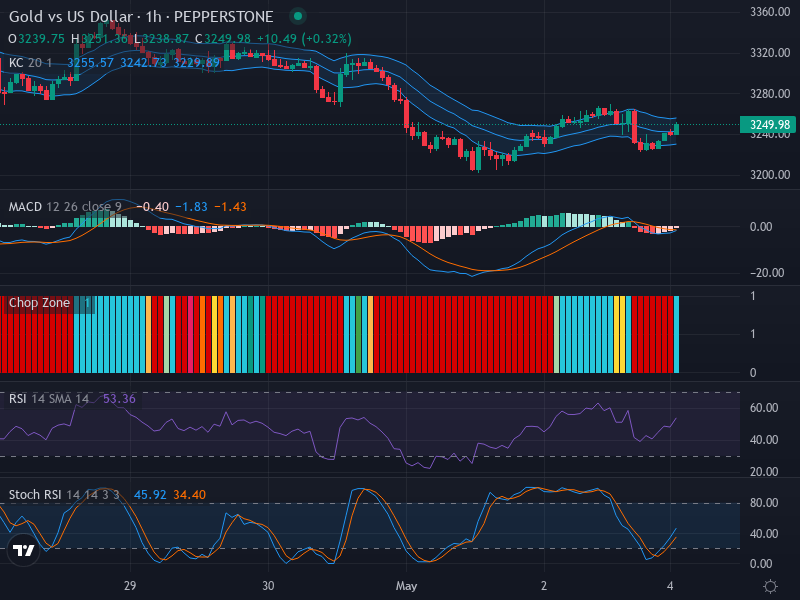
The FOREX market is currently displaying an intriguing interplay between the Gold and US Dollar (Gold/USD), with an emerging trend signaling multiple bullish prospects. The current price point sits at 3249.98 with a gradual upward directional shift, offering traders a favorable setting to track potential moves further.
Technical Analysis
Initial examination of the prevalent candlestick patterns teases an impending bullish phase. This outcome is prompted by a sequence of bullish engulfing formations, best emphasized by the appearance of overshadowing green candles subsequent to relatively smaller red ones. Such a pattern often points towards the domination of buying pressure over selling forces—an encouraging sign for bullish traders.
Along the trend’s narrative, an attention-worthy resistance level has been identified around the 3255 mark, aligning itself conveniently with the higher band of the Keltner Channel. Swing traders, in particular, would do well to keep a close watch on this level, as it might either present a hurdle for price ascent or possible breaching scenarios that could cement bullish dominance.
Turning to some integral technical indicators, the Relative Strength Index (RSI) currently stands at 53.36—a neutral position, tilting slightly towards the bullish edge. It signifies a subtle balance of power in the market, with the positive inclination potentially foretelling a bullish momentum build-up. However, from a divergence analysis perspective, RSI and price movement seem to harmonize, stripping away any imminent divergences that could inject uncertainty into the mix.
Observing the Keltner Channels and Chop Zone provides a more comprehensive perspective on market behavior. The price activity is positioned nearly midway in the EMA 20—signifying a neutral to slightly bullish channel mood. Volatility appears moderate, lacking significant channel width expansion to outline drastic price swings. In contrast, the Chop Zone, an efficient measure of market direction, suggests a sideways phase signified by uninterrupted red bars. This accumulation phase may indicate that the market is gathering momentum for a potentially significant movement.
Lastly, the Stochastic RSI, a powerful momentum oscillator, further bolsters a bullish outlook with a recent crossover—where K value (45.92) currently surpasses the D value (34.40). This event is a positive indication that often precedes an upswing in market prices.
Conclusion and Trading Recommendations
In light of the accumulative technical evidence, traders can expect to witness an upward drift in the Gold-USD pair. The observed bullish engulfing pattern, alongside supportive RSI and Stoch RSI readings, intensifies the probability of such an event. Therefore, traders would likely benefit from long positions while monitoring the key resistance level at 3255 cautiously.
Trend Analysis by Time Frame
- 1-Week Time Frame: The bullish engulfing pattern suggests a strong potential for upward movement, indicating a long-term buying trend.
- 1-Day Time Frame: Price action shows higher lows and a bullish momentum build-up, reinforcing prospects for buying opportunities.
- 4-Hour Time Frame: Short-term candles present a mixed view; however, the overall bullish sentiment poses a likelihood of rising prices.
In consideration of these analyses, potential entry points can be established in the 1-hour time frame. This comprehensive view suggests:
- Buy Entry Point: 3250.00; Take Profit Point: 3265.00; Stop Loss Point: 3240.00.
- Sell Entry Point: 3240.00; Take Profit Point: 3225.00; Stop Loss Point: 3250.00.
Overall, given the current bullish signals, a Buy scenario appears more likely to materialize, presenting favorable trading opportunities. It’s essential, however, to exercise prudent risk management as market conditions can swiftly change.


