Euro vs. US Dollar: Bearish Market Context with Potential Reversal Signs – 27/03/2025
Tháng 3 27, 2025
USD/JPY Currency Pair: An In-depth Analysis of the Lateral Market Movement – 27/03/2025
Tháng 3 27, 2025Market Overview
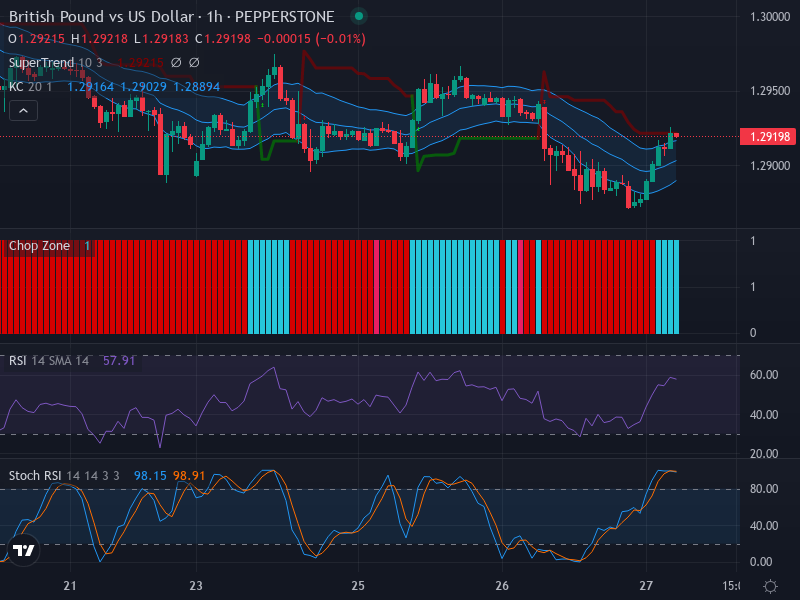
The British Pound versus the US Dollar (GBP/USD) has been seeing a soft upward nudge in the recent trading hours, as suggested by the bullish candlesticks. The market sentiment reflects a somewhat mixed inclination with a mild upward bias currently leading the charge.
Technical Analysis
Reading from the trenchant candlestick patterns exhibited on the chart, it’s quite observable that a surge in price near the level of 1.2920 might be imminent. This is substantiated by the recent upward break of the candlestick, skimmed along the middle band of the Keltner Channel.
Turning to the Relative Strength Index (RSI), this vital metric stands at 57.9, firmly positioned in the neutral zone. Despite not signifying overbought or oversold market conditions, the RSI closely aligns with the subtle upward price tendency thus showcasing support for the ongoing price trend.
The GBP/USD price floats around the middle band of the Keltner Channel, a sign that leans towards a neutral to mildly bullish trend. In terms of volatility, the width of the Keltner Channel designates a moderate range. Meanwhile, the Chop Zone’s cyan bars hint at a potential for sustained sideways movement or an approaching breakout, further elaborating the trading signal as neutral to lightly bullish.
The Stochastic RSI also adds a significant layer to this analysis. With the K line at 98.15 and the D line at 98.91, both indicators fall under the overbought category. The current appearance of these values lacking a crossover implies a continuation of the upward momentum. However, due to the overbought condition, it’s crucial for traders to tread carefully.
Conclusion and Trading Recommendations
The prevailing market sentiment for GBP/USD experiences a mild bullish tilt. As reflected in the interpretative indicators such as the RSI, Keltner Channels, and the Stochastic RSI, there’s potential for an upward movement that could be realised should the price sustain above the 1.2920 level.
However, traders should exercise vigilance due to the overbought condition suggested by the Stochastic RSI readings. Therefore, monitoring the price trend closely for a potential reversal or breakout could be a wise trading strategy under current circumstances. It’s an opportune time to seek long positions, albeit with a sizable level of caution and keen stop-loss strategy.
Risk Disclaimer
Please note that all trading inherently involves risk, including the potential loss of principal. This analysis does not guarantee profits and cannot be held responsible for losses incurred due to market movements. Traders should conduct adequate research, involve professional financial advisors, and exercise due diligence before making any trading decisions.