No Special News Today: Understanding AI Enthusiasm in 2025
Tháng 4 22, 2025
Bull Run on the Horizon for US Dollar vs Japanese Yen? A Comprehensive Forex Analysis – 23/04/2025
Tháng 4 22, 2025Market Overview
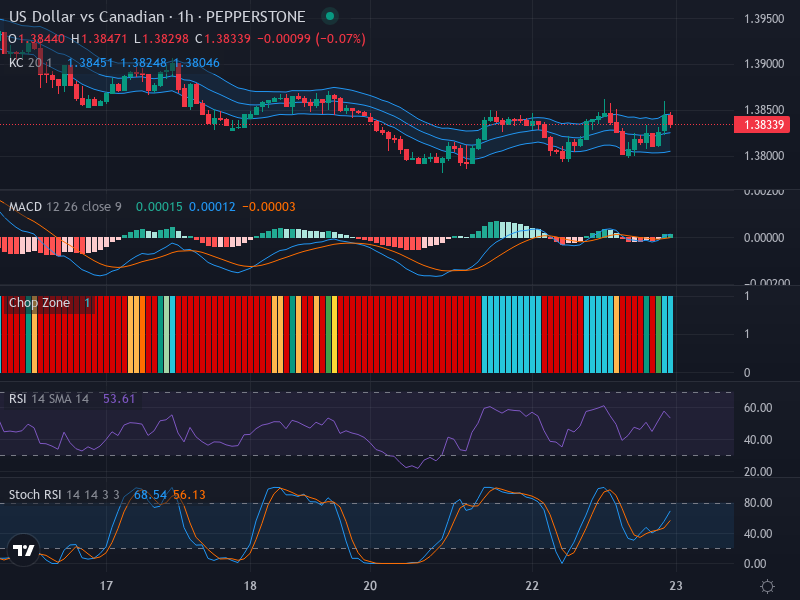
The current USD/CAD forex market scenery witnesses a lax horizontal movement, showcasing feeble subsequent fluctuations with a marginal bullish bias. The pair is trading at 1.38339 and remains devoid of any prominent bullish or bearish momentum that could potentially dictate the future market course.
Technical Analysis
USD/CAD’s one-hour chart reflects recurring episodes of consolidating price tendencies, epitomized by numerous petite candlesticks that neither lean decisively towards a bullish nor bearish preference. The absence of any explicit bullish or bearish formations enveloping the current price further compounds the scenario.
Key resistance and support zones are set up at 1.38500 and 1.38000, with shifting dynamics expected to unfurl their course following a breakout or breakdown from these preordained levels. The forex chart, however, does not indicate any significant activity or indication towards a forthcoming breakout or breakdown, further underscoring the consolidative mood.
The Relative Strength Index (RSI), currently valued at 53.61, aligns with the ongoing neutral bias, while it points towards an absence of any imminent major market maneuverings. There’s no obvious RSI divergence detected, reasserting the market’s current neutral stance.
The Stochastic RSI, with K and D lines valued at 68.54 and 56.13 respectively, indicates a slight bullish bias, primarily represented by the K line’s position above the D line. Nevertheless, this bullish slant is relatively muted given the meager divergence between two lines.
Lastly, the Keltner Channels reinforce the view of the pair’s long-term consolidation trend as it stays snug to the middle band. The accumulation zone, signified by the Chop Zone bars, remains conspicuously dull.
Conclusion and Trading Recommendations
In light of the prevailing market behavior, traders should stay on the sidelines, adopting a wait-and-watch strategy. Until a significant breakout or breakdown materializes to point towards a solid market trajectory, involvement in the USD/CAD pair should be through limited positions.
Once a decisive market direction emerges, traders may consider adjusting their positions accordingly. Should the pair breach the resistance level at 1.38500 (possible long entry), or shatter the support level at 1.38000 (possible short entry), involvement should be commensurate with the respective breakout/breakdown.
Trend Analysis
- 1-Week Time Frame: The market shows signs of continuation in its sideways trend, with no strong momentum suggesting a breakdown.
- 1-Day Time Frame: A neutral bias prevails with minimal fluctuations, allowing for limited price movements.
- 4-Hour Time Frame: The consolidation continues as the price hovers around key support and resistance levels without addressing either point decisively.
Potential Entry Points
Buy entry point: 1.38505, Take profit point: 1.39000, Stop loss point: 1.38200.
Sell entry point: 1.37995, Take profit point: 1.37500, Stop loss point: 1.38100.
In summary, the analysis suggests that neither Buy nor Sell scenarios dominate, yet the Buy scenario has a slight edge if the resistance is breached, while a Sell scenario becomes relevant on a breakdown of the support level.