
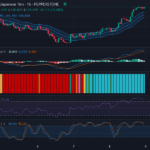
US Dollar vs Japanese Yen: A Rally towards Resistance Amidst Overbought Conditions – 09/05/2025
Tháng 5 8, 2025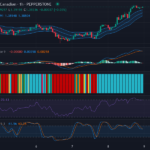
Bullish Momentum Sustains for USD/CAD; Overbought Conditions may Herald Volatility – 09/05/2025
Tháng 5 8, 2025Market Overview
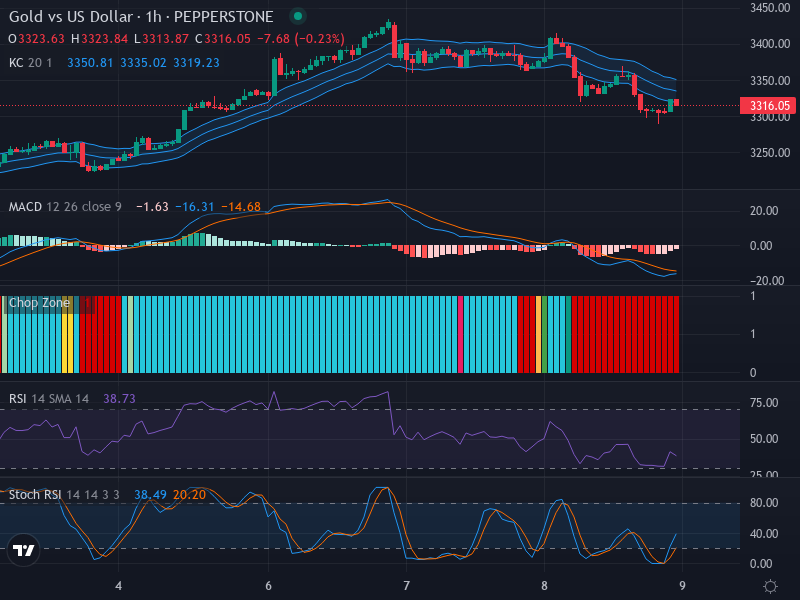
The Forex market has recently been witnessing a prolonged downward trend in the gold versus USD pair. The current price stands at 3316.05, amidst significant bearish sentiments and absent reversal patterns, suggesting the potential furtherance of the downtrend.
Technical Analysis
Candlestick Pattern Evaluation
The market direction is dominantly bearish in recent days as evidenced by the regular formation of candles below the middle band of the Keltner Channels indicating maintained pressure from sellers. Moreover, the lack of visible bullish reversal patterns such as a bullish engulfing or hammer pattern further substantiates such observations. However, an interesting observation to note is the possible price action near the 3300 level, which might induce an uptrend if reversal patterns develop near this mark. In that case, the resistance level is projected to surface around 3350.
Relative Strength Index (RSI) Assessment
With a current RSI value of 38.73, the gold/USD pair is nearing oversold territory. The position of the RSI below the 50 mark corroborates the bearish trend, underlining the dominance of sell-offs. Furthermore, the price-RSI relation has not presented any significant divergence that might hint towards a trend shift.
Stochastic RSI Examination
The recent Stochastic RSI values, K at 38.49 and D at 20.20, reflect a continuation of the bearish sentiment. The position of both K and D below the 50 mark confirms the prevailing downtrend. However, it’s important to note a probable bullish crossover as the K line approaches the D line, suggesting possible short-term bullish activities.
Moving Average Convergence Divergence (MACD) Analysis
The current MACD line value of -16.31 signifies a position below the signal line at -14.68. This configuration typically indicates surged selling pressure translating into a bearish outlook.
Conclusion and Trading Recommendations
In the light of the ongoing bearish trend alongside the lack of clear signs of reversal, investors might want to bear a vigilant eye on the gold/USD market. It is important to keep in mind the oversold indications from the RSI and potential bullish crossover in the Stochastic RSI. Investors are advised to watch for possible reversal indications before considering long positions.
Monthly, Daily, and Hourly Trends Analysis
- On the 1-week time frame, the trend remains distinctly bearish, showing no immediate signs of reversal as prices continue to stay below critical moving averages.
- In the 1-day time frame, the gold/USD pair displays bearish momentum with continuous lower lows, indicating sustained selling pressure among traders.
- Over the 4-hour time frame, while there are hints of consolidation, the overall sentiment leans towards bearish as price action struggles to break through resistance levels.
Based on these time frames, we can identify potential entry points: for a Buy scenario, we suggest an entry point near 3305, a take profit point at 3350, and a stop loss at 3280. Conversely, for a Sell scenario, an entry point could be set at 3310, a take profit point at 3250, and a stop loss at 3325. Given the prevailing analysis and trends across these indicators, it appears that a Sell scenario is more likely to occur in the near term.


