EUR/USD: Potential Short-term Reversal Amid Prevailing Downward Trend – 12/05/2025
Tháng 5 11, 2025
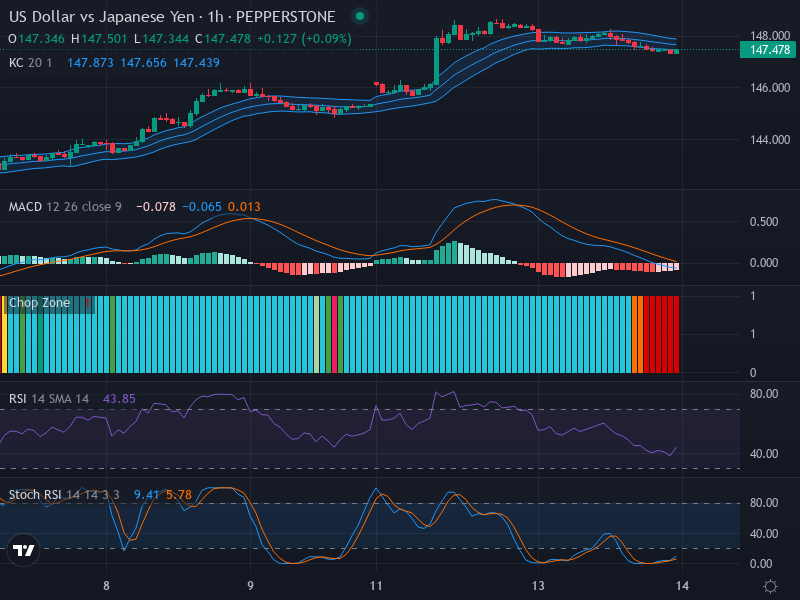
USD/JPY Solidifies Upward Trend Amid Market Indicators – 12/05/2025
Tháng 5 11, 2025Market Overview
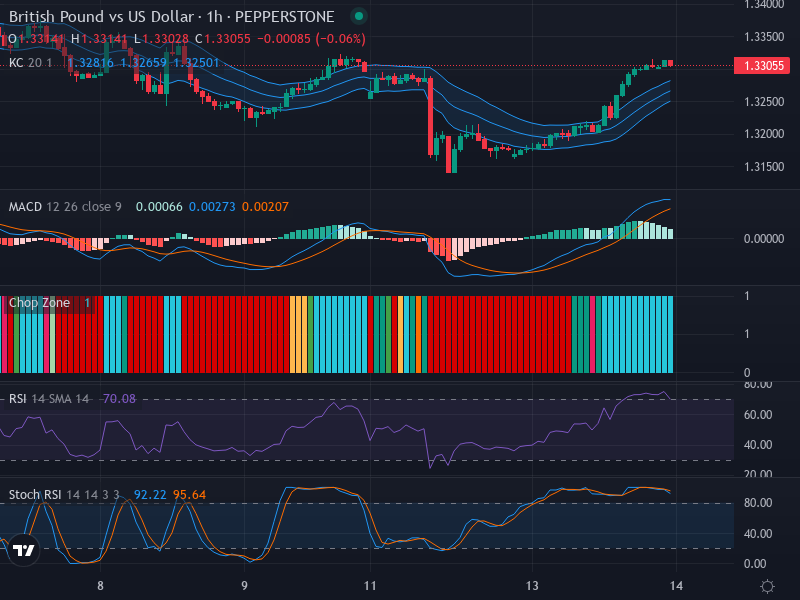
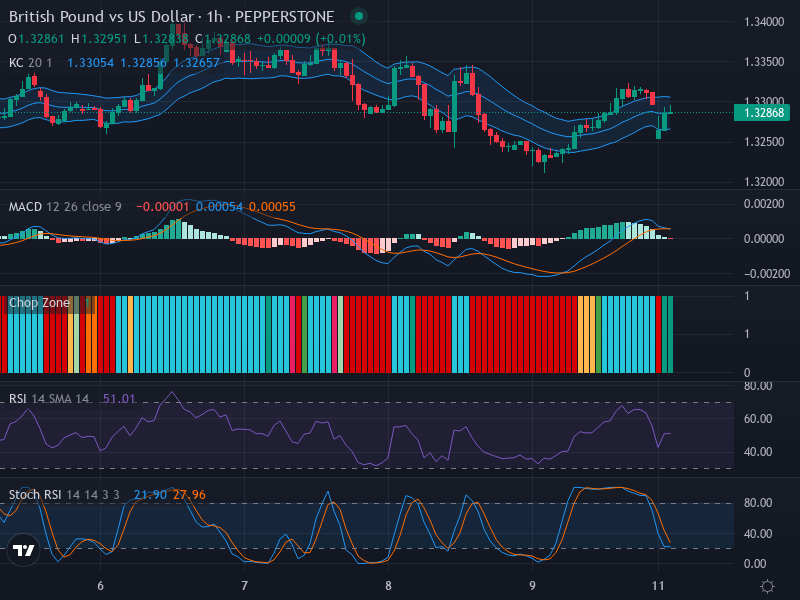
The GBP/USD pair is one of the highest traded currency pairs in the Forex market, providing a wealth of trading opportunities. Currently, the foreign exchange rate stands at 1.32868, reflecting an upward trajectory with recently formed bullish green candlesticks that have surpassed previous highs. The significant appearance of a hammer formation indicates a potential bullish reversal following a sustained period of downtrend.
Technical Analysis
Starting with the candlestick patterns and price action, there is a notable hammer formation that has emerged recently. This pattern typically signifies a potential reversal of the bearish trend, suggesting an upcoming bullish momentum. Moreover, the market trend is currently upward, with bullish green candlesticks breaking through past peaks, reinforcing the bullish scenario.
In terms of pivot points and potential zones for price action, a surge might be anticipated if prices break above the critical resistance level of 1.3300. Conversely, retracement levels might be identified around the support level of 1.3250, serving as a critical stop for any downward correction.
Delving deeper into the technical indicators, the Relative Strength Index (RSI) currently sits at a neutral value of 51.01. This reading signals market indecision and indicates neither an overbought nor an oversold condition, slightly validating the recent upward movement.
Additionally, the Stochastic RSI shows both K and D values at 21.90 and 27.96 respectively, placing them in the oversold territory and suggesting a potential upward move. This adds to the bullish sentiment.
Moreover, the Moving Average Convergence Divergence (MACD) analysis reveals a bullish crossover, with the MACD line positioned slightly above the signal line. The fading upward bars in the histogram indicate that the bearish momentum is losing ground, further supporting the bullish outlook.
Conclusion and Trading Recommendations
Based on the comprehensive technical analysis of the GBP/USD Forex pair, a viable upward trend is anticipated. The bullish signals from the hammer formation, combined with positive indications from the RSI, Stochastic RSI, and the fading bearish MACD histogram, collectively forecast an optimistic bullish agenda. Traders may want to closely monitor this pair and consider long positions, particularly targeting the critical resistance level of 1.3300.
Summary of Time Frames Analysis:
- In the 1-week time frame, the market shows consistent bullish momentum, confirmed by successive green candlestick formations.
- The 1-day analysis highlights a strong recovery phase from bearish trends, with indications pointing towards continued upward movement.
- In the 4-hour frame, bullish signals prevail, with recent price action confirming upward breakouts past previous resistance levels.
From this in-depth analysis, potential entry points can be formulated for the 1-hour timeframe. Considering the above indicators:
- Buy entry point at 1.3288, take profit at 1.3340, stop loss at 1.3260.
- Sell entry point at 1.3255, take profit at 1.3200, stop loss at 1.3280.
Given the current bullish momentum along with technical indicators supporting upward movement, the Buy scenario is more likely to occur. Traders should proceed with caution and remain aware of the inherent risks associated with Forex trading, ensuring they manage their investment strategies appropriately.