Grounded Bearish Outlook: USD/JPY Faces Stiff Downward Pressure – 03/04/2025
Tháng 4 2, 2025
Navigating Market Volatility: An In-Depth Study of AUD/USD in Uncertain Times – 03/04/2025
Tháng 4 2, 2025Market Overview
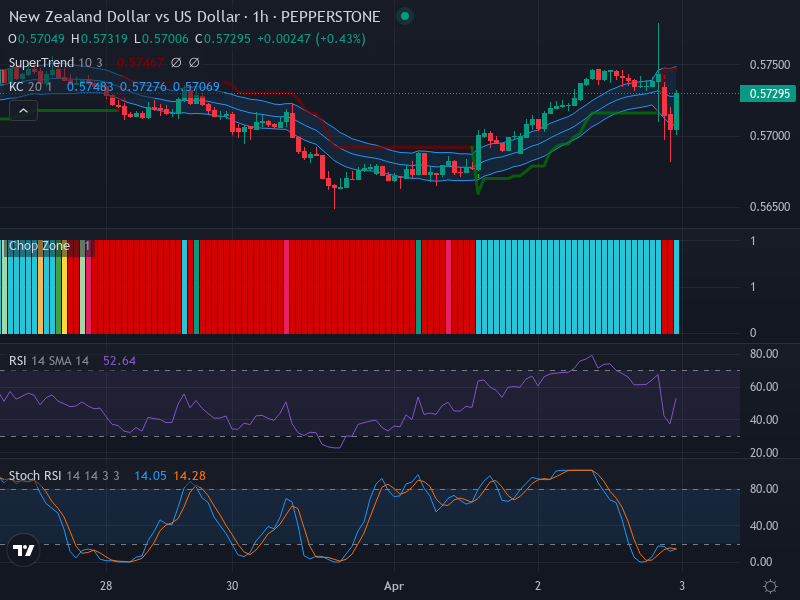
The Forex market is currently exhibiting a steady upward trend with the NZD/USD pair. The recent bullish candlesticks suggest more room for an upward trajectory, highlighting a prevailing bullish sentiment among traders. Key potential zone for price surges is anticipated around 0.57500, contingent on the continuation of the current upward trend.
Technical Analysis
The recent chart pattern reveals a bullish engulfing pattern, a powerful reversal signal, identified on a 1-hour chart. This formation indicates a potentially stronger upward momentum, especially when reinforced by supporting technical elements.
The Relative Strength Index (RSI), which measures the speed and change of price movements, currently stands at 52.64. This RSI value suggests the possibility of sustained upward movements; however, it does not offer a strong confirmation of bullishness, implying that further validation may be necessary.
In addition, a review of the Keltner Channels and Chop Zone indicators affirms the moderate upward trend. With prices hovering just above the middle band of the Keltner Channel, this reinforces the bullish trajectory. The Keltner Channel also signals a slight increase in market volatility, a crucial factor for future trading decisions.
The Chop Zone recently transitioned from red to blue, further indicating a potential shift toward enduring upward momentum.
Examining the Stochastic RSI, both the K and D lines are nearing a bottom crossover, bolstering the forecast of potential upward movement. The Stochastic RSI is recognized for its accuracy in predicting price shifts and presently supports the notion of an upward price trajectory.
Conclusion and Trading Recommendations
An analysis of the 1-week time frame indicates that the NZD/USD Forex market exhibits a neutral to slightly upward trend. If this trend persists, further gains can be anticipated. Therefore, traders should consider employing an optimistic wait-and-see strategy, maintaining vigilant observation of ongoing patterns of bullish indicators before fully committing.
It’s essential to recognize that while the indicators appear to advocate an upward momentum, the market’s nature exposes it to abrupt changes due to factors like global economic developments or shifts in supply and demand.
In summary, based on the analyzed trends across different time frames:
- The 1-week time frame is reflecting a neutral to slightly upward trend.
- The 1-day time frame is exhibiting signs of a potential upward movement, encouraging cautious optimism.
- The 4-hour time frame suggests growing bullish momentum, indicating a favorable environment for buyers.
Potential entry points are as follows: Buy Entry Point at 0.57700, with a Take Profit Point set at 0.58050 and a Stop Loss Point at 0.57500. For the Sell Entry Point, consider entering at 0.57400, with the Take Profit Point at 0.57250 and a Stop Loss Point at 0.57600.
Overall, the Buy scenario appears more likely based on current analysis and supporting indicators.