
Examining the Bearish Sentiment in the Euro vs US Dollar Forex Market – 08/04/2025
Tháng 4 7, 2025
Supreme Court’s Landmark Ruling on Venezuelan Deportation: What It Means for Immigration Policy
Tháng 4 8, 2025Market Overview
The FX pair US Dollar and Canadian Dollar (USD/CAD) seems to be in an indecisive phase, as it demonstrates a largely lateral movement according to recent chart patterns. The market direction appears to be hovering with minor attempts to break on the upside, while remaining within a close range. Consequently, investors and traders keep a keen eye on potential opportunities presented by this balanced phase.
Technical Analysis
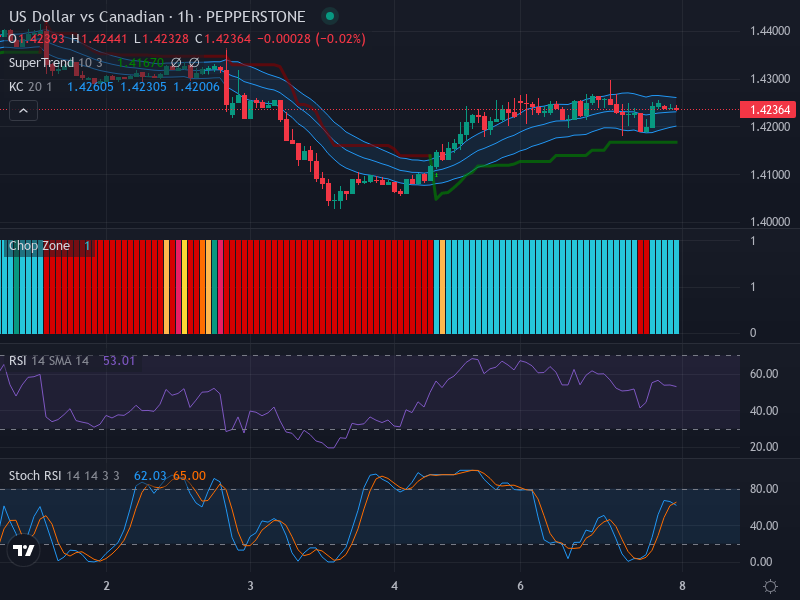
An examination of the USD/CAD hourly chart reveals a sideways market, with candlesticks forming within a defined range. Several noteworthy inferences can be gathered from the chart:
Price Action and Key Zones: Interestingly, there are no significant bullish or bearish candlestick formations like engulfing, doji, or hammer patterns. The absence of such formations further reinforces the ongoing sideways price action. A precise watch should be kept on crucial resistance and support levels at 1.4260 and 1.4200 respectively for possible price surges or retracements.
Relative Strength Index (RSI) Observations: The analytics reveal an RSI value of 53.0, which places it firmly in the neutral zone. This endorses the lack of market momentum in either direction, resonating with the observed lateral movement.
Keltner Channels and Chop Zone Insights: As per Keltner Channels, the USD/CAD price is consistently floating around the middle band. This positioning corroborates the absence of any discernible long-term market trend. Concurrently, the Chop Zone pattern also reflects a sequence of color bars, affirming the prevalence of the sideways market and low volatility.
Stochastic RSI Scrutiny (Stoch RSI): The K Line at 62.03 and the D Line at 65.00 indicate a delicate downward incline. This suggests a marginal bearish outlook, though not strong enough to indicate a trend reversal.
Conclusion and Trading Recommendations
Considering the prevalent neutral market situation, traders might want to adopt a cautious ‘wait-and-watch’ approach for the USD/CAD pair, particularly around the critical support and resistance zones. Any potential breakout or breakdown, hence, could then provide a better trading opportunity, expectedly with higher volatility and momentum.
Analyzing the 1-week, 1-day, and 4-hour timeframes provides these insights:
- The 1-week timeframe indicates stable pricing but with potential for upward movement if resistance is broken.
- The 1-day timeframe shows a tight consolidation pattern that may lead to a breakout, but overall sentiment remains neutral.
- The 4-hour timeframe is exhibiting minor bullish attempts without establishing a definitive trend.
Based on this analysis, potential entry points at the 1-hour timeframe are:
- Buy Entry Point: 1.4265, Take Profit Point: 1.4300, Stop Loss Point: 1.4240.
- Sell Entry Point: 1.4195, Take Profit Point: 1.4165, Stop Loss Point: 1.4210.
Given the current market conditions, it seems that a Buy scenario could unfold should we breach the top resistance at 1.4260, whereas a Sell scenario may be more likely should the support at 1.4200 fail, leading to potential marking of lower levels.


