
Forex Market: A Mixed Climate for USD/JPY Amidst Sideways Movement – 15/04/2025
Tháng 4 14, 2025Morgan Stanley and Citigroup Revise Earnings Estimates: What Investors Need to Know
Tháng 4 15, 2025Market Overview
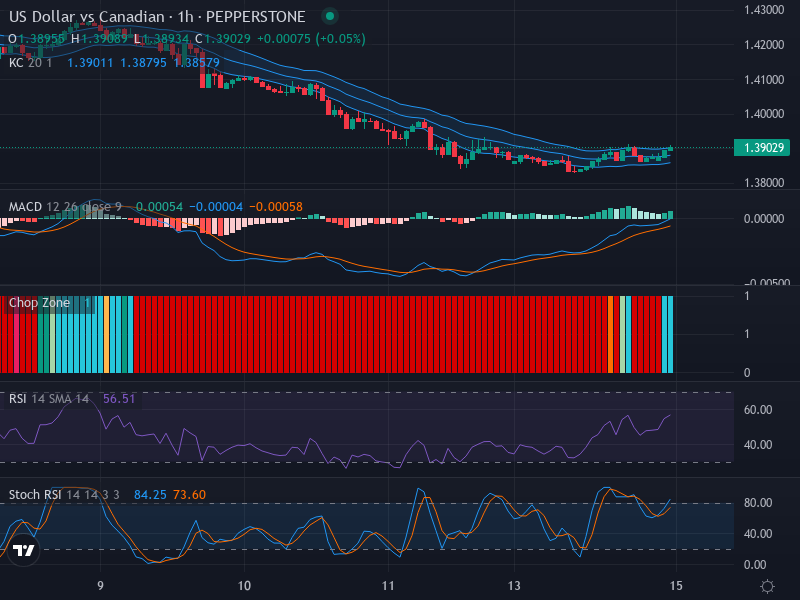
The Foreign Exchange market for the USD/CAD currency pair is at an interesting pivot point. The pair, which had been following a predominant downward trend, appears to be transitioning into a lateral, or sideways, trend. The current price, as of this analysis, is 1.39029. This shift comes amidst burgeoning uncertainties due to the global economic climate and imminent central bank policies.
Technical Analysis
Delving deeper into the technicalities of the chart, the candlestick pattern analysis indicates room for market indecision. The absence of significant bullish or bearish formations means that the playing field is open for an upward surge, especially if the price succeeds in breaching the upper Keltner Channel line. Such a move could indicate a momentum shift in the market favoring the bulls.
Evaluating the Relative Strength Index (RSI) results tells us a similar story. A value of 56.51 situates the currency pair securely in the neutral zone. This neither overbought nor oversold status befits the current sideways market sentiment, suggesting a rather balanced pressure from both buy and sell sides. With no significant divergences observed, the price movements seem to be in sync with the RSI trends.
Next, we turn to the Stochastic RSI signals. The values of K and D lines (84.25, 73.60 respectively) imply an overbought condition. Under normal conditions, this could suggest a possible downside retracement. However, with robust buying momentum persisting, the context becomes less obvious.
Lastly, the Moving Average Convergence Divergence (MACD) analysis teases out a probable crossover, with the MACD line attempting to cross above the signal line. This configuration genuinely leans towards a bullish sentiment, connoting an impending potential positive market shift.
Conclusion and Trading Recommendations
Clearly, the USD/CAD market appears to be oscillating in a neutral territory. Traders must carefully judge, given the blend of bullish and bearish signals reflected in the analysis. Emphasis must be placed on the upcoming crossover in MACD and the overbought scenario painted by the Stochastic RSI. Should the price break the upper Keltner Channel line, there’s potential for a bullish run. However, if the overbought condition pulls down the market, a short position could be beneficial. Investors are encouraged to watch the market closely and place their trades after thorough verification of these points.
Trend Analysis
In summary of our analysis:
- 1-Week Time Frame: The trend shows signs of stabilizing, leaning towards consolidation after a prior downtrend.
- 1-Day Time Frame: Market sentiment presents a cautious perspective, indicating potential indecision.
- 4-Hour Time Frame: Price action is appearing flat, with the possibility of a breakout depending on external influences.
Based on this analysis, potential entry points are:
- Buy Entry Point: 1.39250, Take Profit Point: 1.39550, Stop Loss Point: 1.38900.
- Sell Entry Point: 1.38850, Take Profit Point: 1.38550, Stop Loss Point: 1.39000.
Considering the current indicators and market dynamics, a Buy scenario seems more likely. Traders should maintain vigilance as conditions may rapidly evolve, necessitating quick adjustments to their strategies.
Risk Disclaimer
While this analysis strives to provide valuable insights, financial markets are unpredictable, subject to many influences, and can act contrary to predictions. Potential risks must always be taken into account. Investors are strongly encouraged to conduct their own research and not solely rely on articles or reports for any trading decisions.


