
In-depth Study of USD/JPY – A Phase of Consolidation Followed by Upward Trend – 05/05/2025
Tháng 5 4, 2025
Forex Technical Analysis Today (05-05-2025) – 05/05/2025
Tháng 5 4, 2025Market Overview
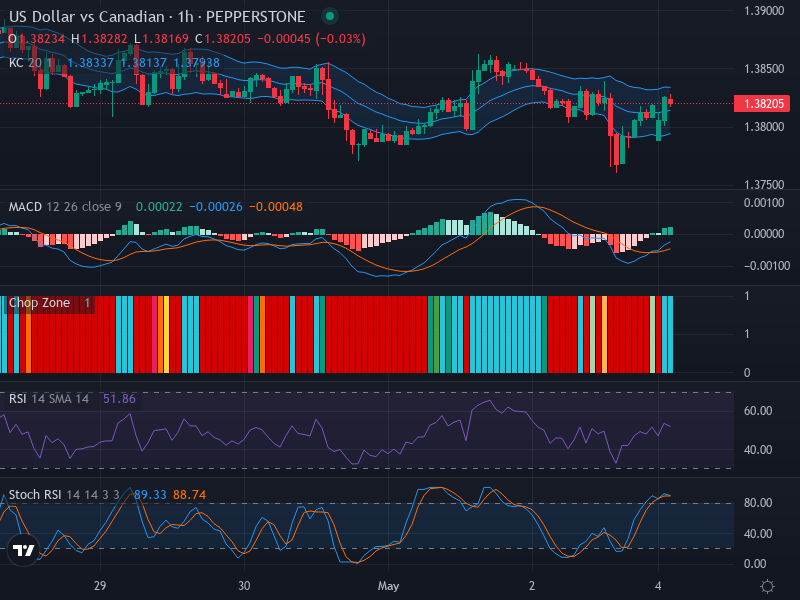
As the American and Canadian economies negotiate through the uncertainties of the global market, the forex market endures its course of unease. The present status of the USD/CAD (U.S. Dollar vs Canadian Dollar) pair is suggestive of a slight bullish trend with an equilibrium leaning towards the neutral zone. This observation is based on recent mild upward movements in the market supported by various technical indicators.
Technical Analysis
Analyzing the current scenario from a candlestick pattern perspective, it’s noticeable that there are no major formations, such as bullish engulfing or doji patterns. Instead, the recent candlesticks illustrate mild bullish momentum. The market direction leans towards a minute upward movement that suggests a short-term bullish trend.
Let’s examine the potential zones for the pair. The price might encounter resistance near the upper echelon of the Keltner Channel band around 1.38327. On the flip side, support should surface around the middle band at 1.38137. These ranges could act as a navigational waypoint amid the currently volatile conditions.
The Relative Strength Index (RSI), a key momentum oscillator, currently reads at 51.86, placing it closer indeed to the neutral zone. This denotes a slightly bullish momentum that parallels the candlestick pattern analysis. No significant divergences are evident comparing the RSI value and price movement, reinforcing the idea of a persisting neutral bias.
Further insights from the Stochastic RSI elucidate impending short-term possibilities. The K and D values of the Stochastic RSI are in the overbought territory, which typically suggests potential short-term consolidation or correction on the horizon. A recent crossover indicates a slowing bullish momentum if the K line crosses below D.
Lastly, the Moving Average Convergence Divergence (MACD) further supplements the above analysis. The MACD line is just above the signal line, which traditionally suggests a continuation of the bullish momentum but with a waning intensity. The Histogram bars reflect the identical narrative of a mild bullish drive but are starting to show signs of a slowdown.
Conclusion and Trading Recommendations
In summary, current technical analysis of the USD/CAD leans on a mildly bullish sentiment, but impending signs suggest a potential consolidation or stalling of the upside momentum. This lends towards a neutral standpoint. Traders could opt for a cautious approach, potentially aiming for short-term trades between the identified support and resistance levels. With a view of potential consolidation, they can monitor for cues of breaking this range for a more decisive trade opportunity.
Trend Analysis by Time Frame
The analysis of the respective time frames indicates the following trends:
- 1-Week: Generally maintains a bullish trend but risks stabilization or consolidation.
- 1-Day: Shows slight bullish bias, yet indicates a pause or potential correction.
- 4-Hour: Observes neutral sentiment, hinting at a potential build-up before any decisive movement.
Based on these observations, potential entry points have been derived for the 1-Hour time frame:
- Buy Entry Point: 1.38200; Take Profit Point: 1.38450; Stop Loss Point: 1.37950.
- Sell Entry Point: 1.38100; Take Profit Point: 1.37850; Stop Loss Point: 1.38300.
After careful consideration of the analysis, a buy scenario seems slightly more probable given the current market momentum, albeit with caution towards the impending consolidation signal.
Risk Disclaimer
This analysis includes a number of assumptions based upon historical patterns and current market indicators. These projections ought to be treated as conjecture and their completion is certainly not guaranteed. All forms of trading and investment includes risk, so one should not commit any funds that they cannot afford to lose. Always trade responsibly.


