

Premarket Stock Insights: Peloton, Tapestry, Shopify & AppLovin in Focus
Tháng 5 8, 2025FTSE 100’s Rollercoaster Ride: Market Expectations Shift Ahead of Key Monetary Policy
Tháng 5 8, 2025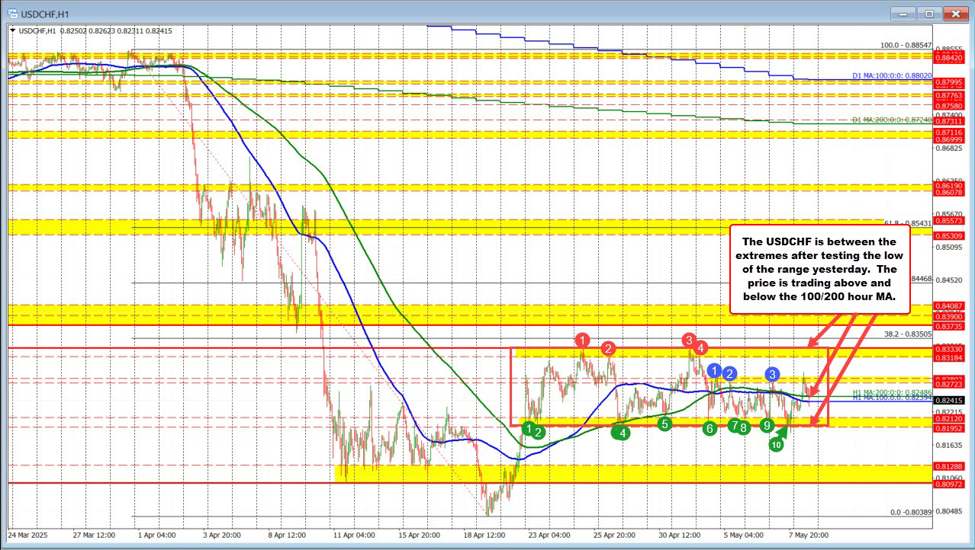
USDCHF Technical Range and Moving Average Dynamics: An In-Depth Analysis
As we navigate the complexities of the forex market, the USDCHF currency pair has recently found itself in a significant consolidation phase. Currently, USDCHF is operating within a well-defined technical range, wherein key support is observed around 0.8195 and resistance near 0.8333. This environment of compressed price action indicates ongoing indecision amongst traders as they await more concrete directional signals that could guide future movements.
The Significance of the 100/200-Hour Moving Averages
A crucial aspect of the current market dynamics is the positioning of the 100-hour and 200-hour moving averages (MAs), which lie closely clustered between 0.8255 and 0.8259. These moving averages are currently acting as short-term resistance levels. A decisive price movement above this MA cluster would likely shift the short-term bias favorably upwards, potentially targeting the upper boundary of the range at 0.8333 and potentially even higher.
Conversely, should the price fail to maintain above these critical moving averages, traders may see USDCHF retest the lower support levels, presenting further challenges to bullish traders. This intricate interplay between price action and moving averages underscores the importance of monitoring these levels closely for insights into the market’s direction.
For more insights on similar market dynamics, you can explore the analysis of the USD/CAD market which also highlights the significance of understanding current trends.
Understanding Support and Resistance Levels
Traders must also pay heed to the delineation of support and resistance levels, which play a pivotal role in shaping market behavior.
Resistance levels to be aware of include the 0.8255–0.8259 area marked by the 100/200-hour MAs, alongside swing highs near 0.8318-0.8333 and a notable retracement at 0.8350. On the flip side, support can be found in the range of 0.8195-0.8212, which marks the lower boundary, while more substantial support exists further down at 0.8097-0.8128 and a historical low at 0.8039 from 2011. Understanding these levels can aid traders in plotting their strategies and anticipating potential market movements.
For additional strategies related to support and resistance levels, refer to the strategies outlined in the analysis of the GBP/USD situation.
Broader Context and Market Influences
While technical analysis suggests potential bullish momentum for the USDCHF pair, broader market dynamics should also be considered. Recent indicators point to an early bullish reversal, bolstered by a breakout from previously bearish structures and the appearance of a strong bullish engulfing candle.
Traders are closely monitoring U.S. Federal Reserve policy decisions and economic data releases, as these factors are likely to introduce volatility and heavily influence USDCHF’s direction within its current range.
Short-term outlook remains optimistic, with stability above 0.8200 contributing to positive momentum. Additionally, the Relative Strength Index (RSI) is showing indications of recovery from oversold conditions, which supports the potential for further upside in the pair. A similar analysis of market conditions can be found in the examination of the EUR/USD, which also discusses market movements during consolidation phases.
Conclusion: A Range-Bound Future Ahead
As it stands, USDCHF continues to operate within a range-bound environment, where the 100/200-hour moving averages at 0.8255–0.8259 serve as critical pivot points. A sustained move above these levels would indicate a shift towards a stronger bullish bias. However, vigilance is required; failure to uphold these levels could trigger a retest of lower support zones, which would pose new challenges for traders. Understanding these dynamics is essential for navigating the complexities of the USDCHF currency pair as we move forward in this market environment.